2023 - TBD
2022 - Elm City Stories
The 2022 DataFest challenge came from the Play2Prevent lab at the Yale Center for Health & Learning Games in the Yale School of Medicine. DataFest participants analyzed data from Elm City Stories, an educational video game designed for middle and high school students. The goal of the game was to prevent negative health outcomes in young, at-risk adolescents by helping teens to increase perception of risk and to develop skills for predicting and understanding future consequences of actions. The DataFest challenge was to characterize, measure and display patterns of play within the game that the researchers could then use to make connections to real-life behavior.Description credit to OSU Datafest page
2020 & 2021 Cancelled :(
2019 - Canadian Womens Rugby
We had 48 students from 6 different schools register as 12 teams. The diversity of the student majors was remarkable. This year we had representation from Mathematics & Statistics (35%), Computer Science (26%), Business (28%) and Other majors (17%). In the end, six teams presented their findings. Each team had five minutes and a maximum of two slides (one team created a video presentation) to present findings to a panel of judges.
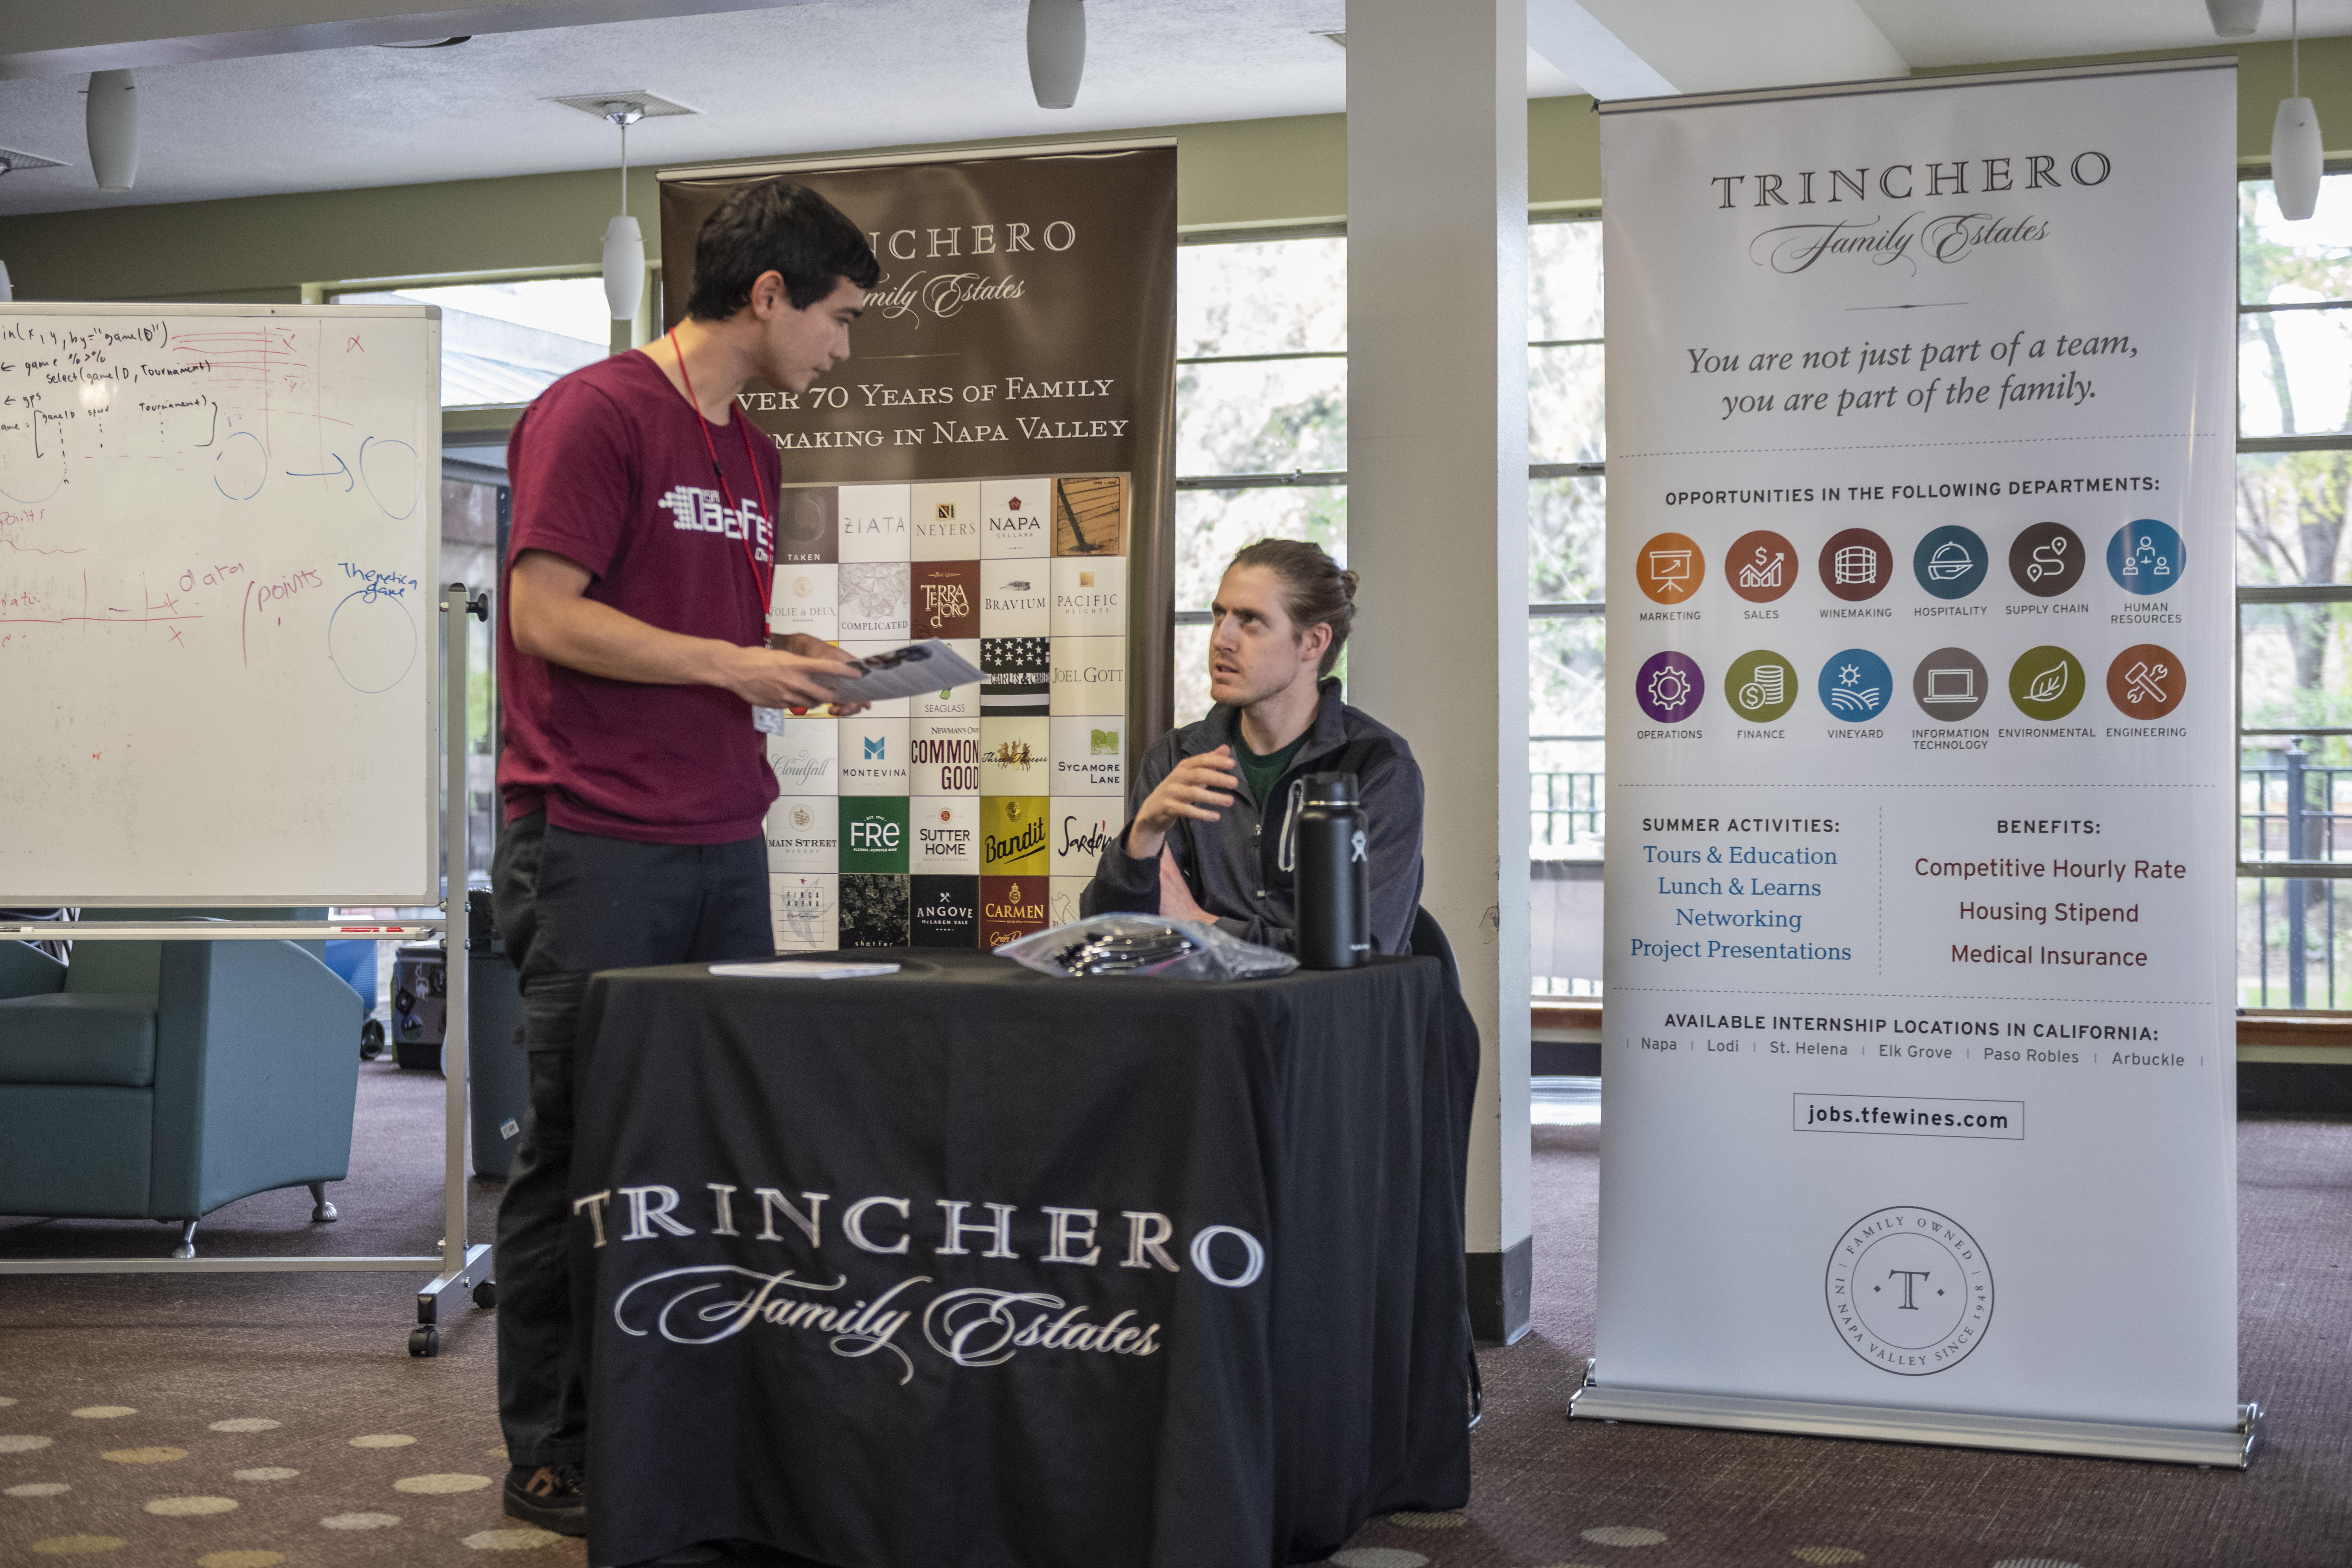
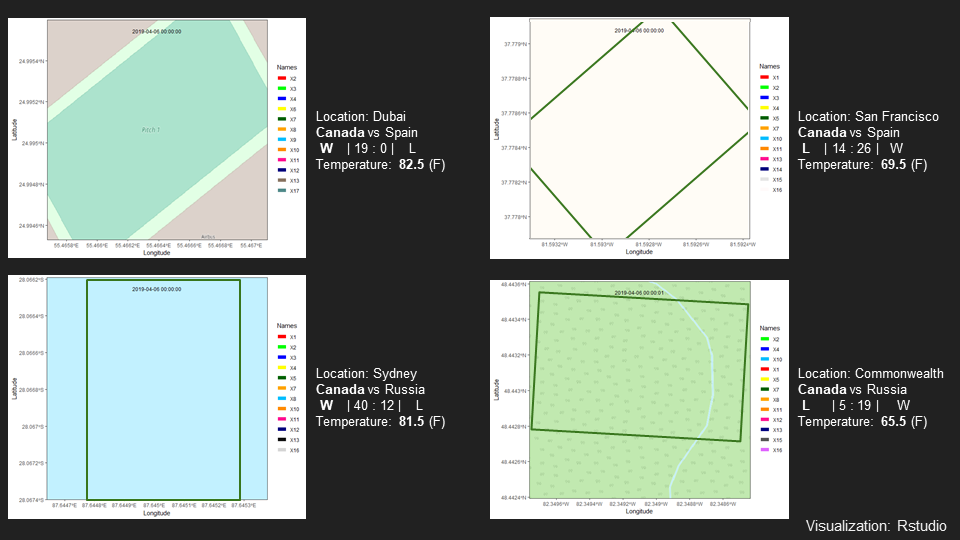
The data this year was provided by the Olympic Champion Canadian National Womens Rugby team. A complex set of four different datasets containing GPS tracking data during games, physical wellness surveys, and training workload. The data provider asked students to consider role of workload and fatigue in Rugby 7’s, a fast-paced very physically demanding sport that pushes the limits of athletic speed, endurance and toughness.
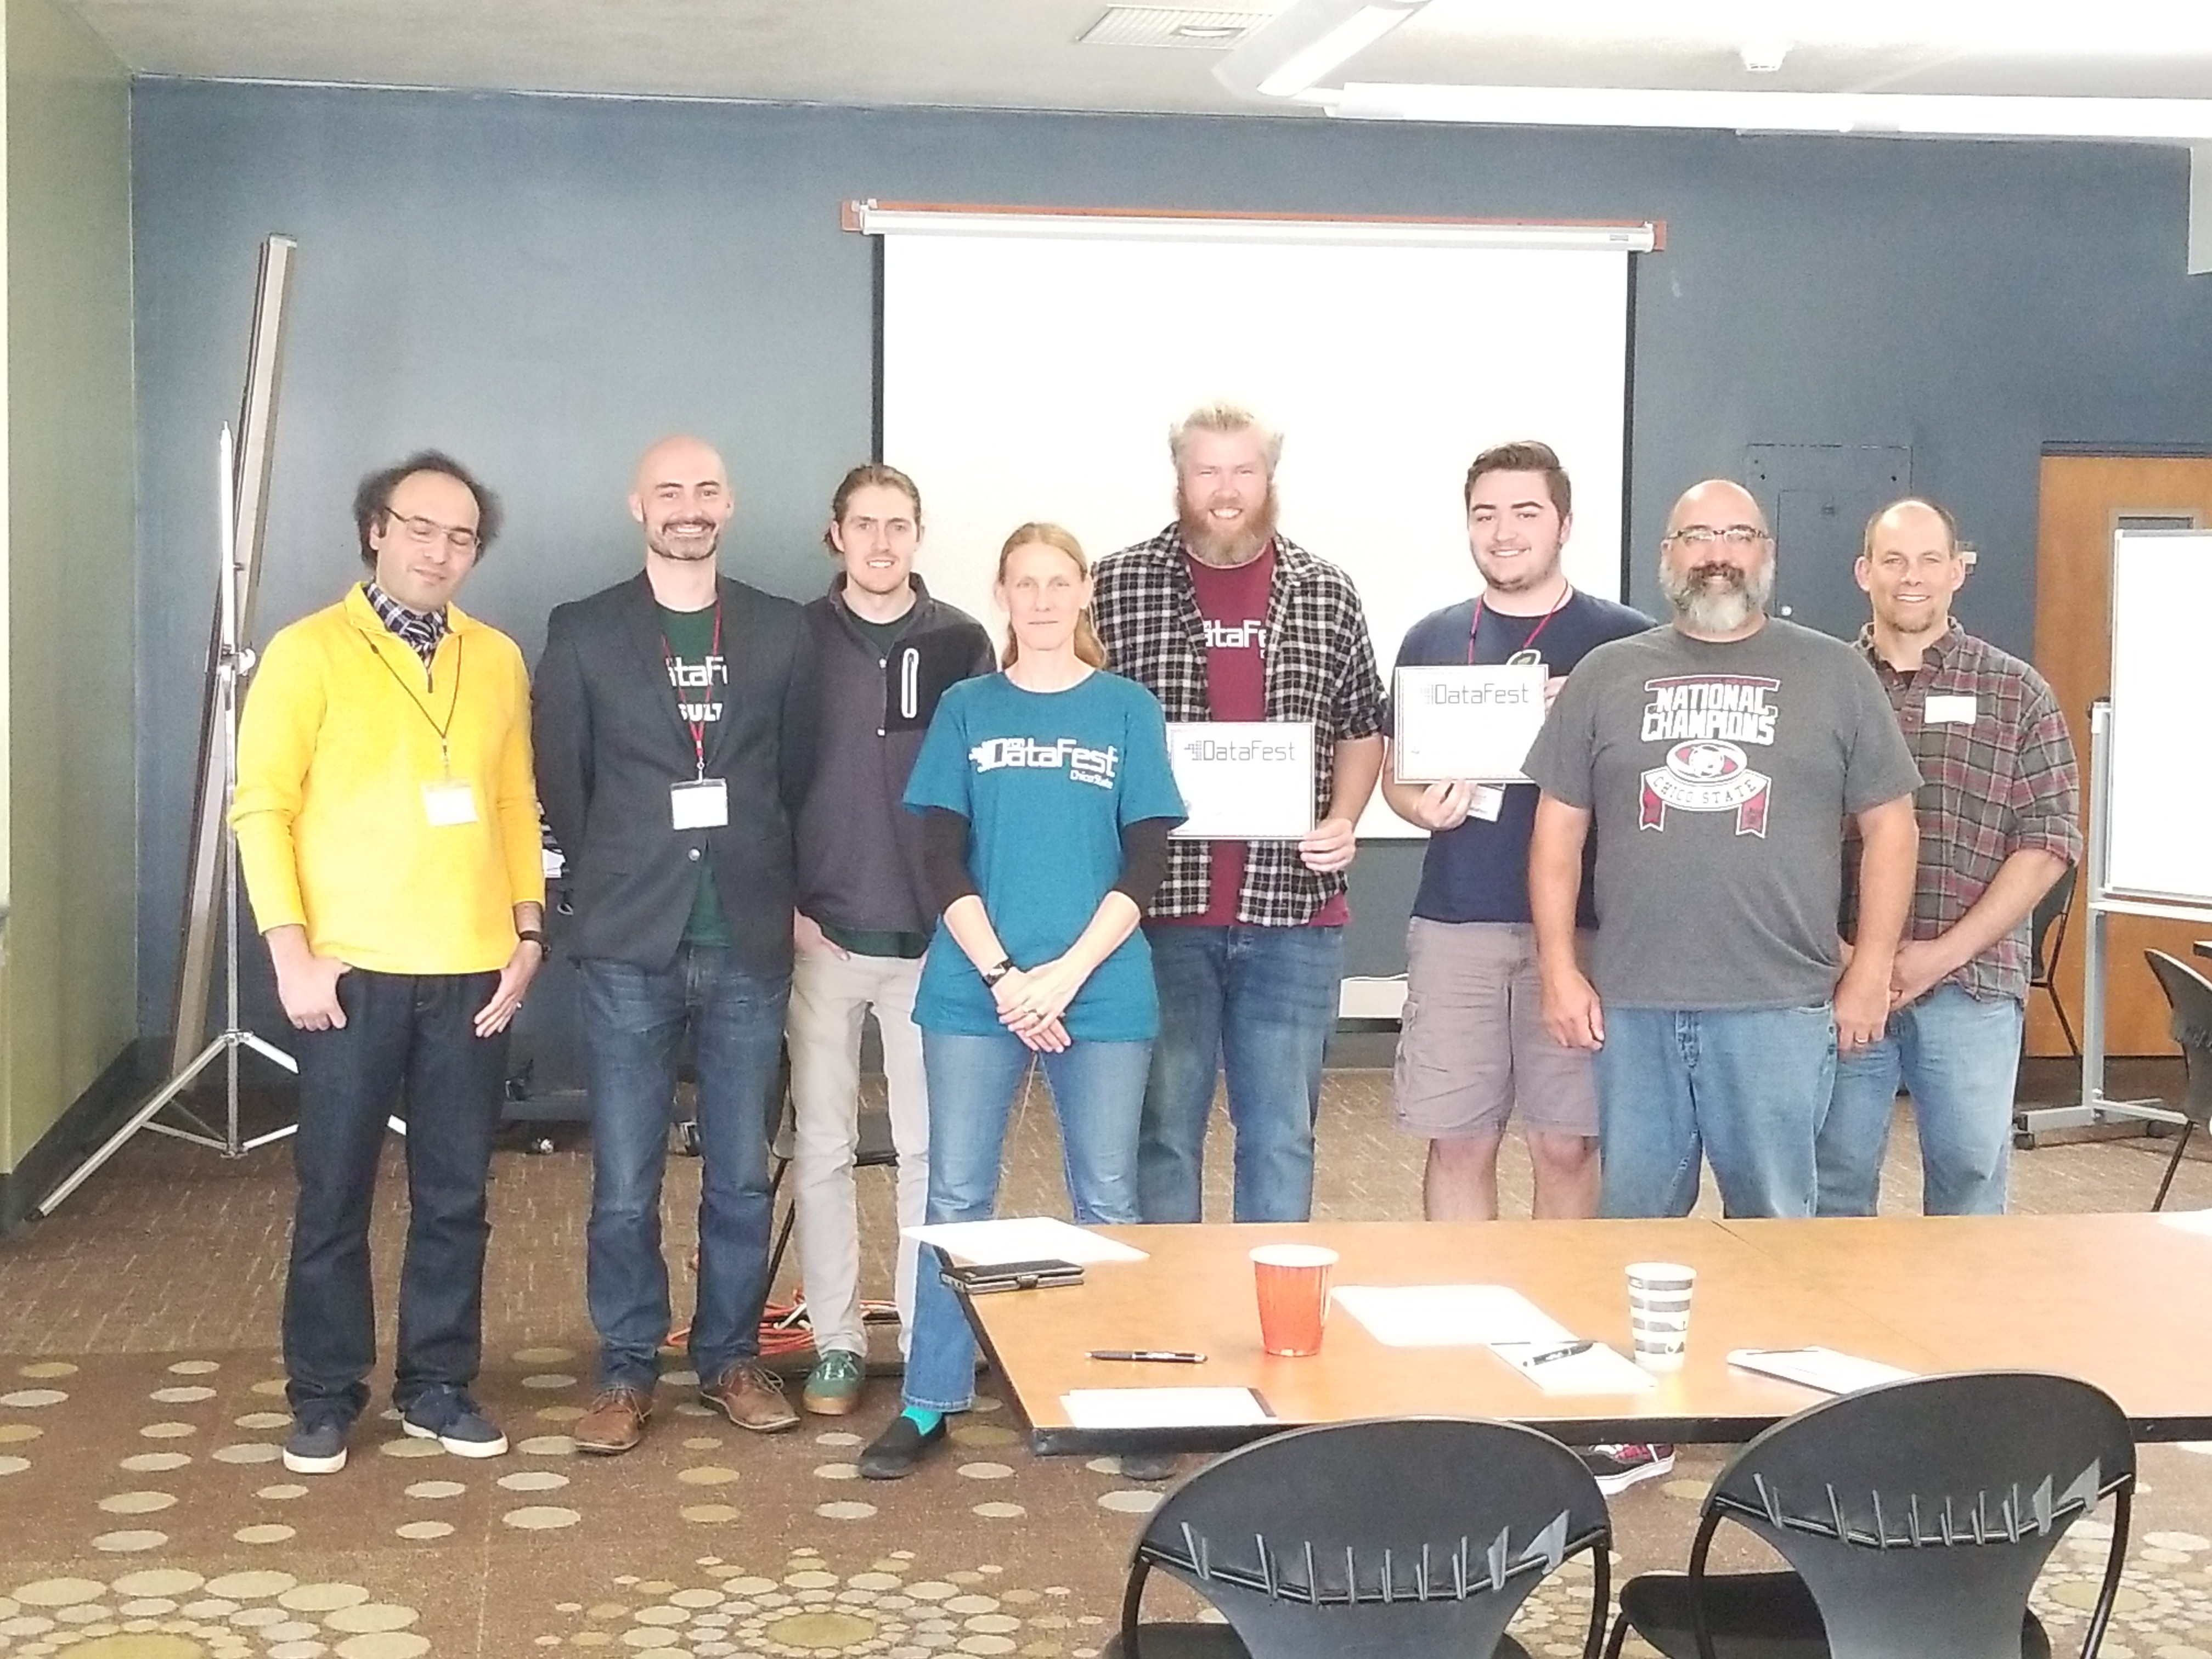
Teams presented informative findings on what an optimal training workload could look like at different points in the season, or how certain summative wellness measures that are currently being used could be optimized to provide better predictive ability. The winning teams were:
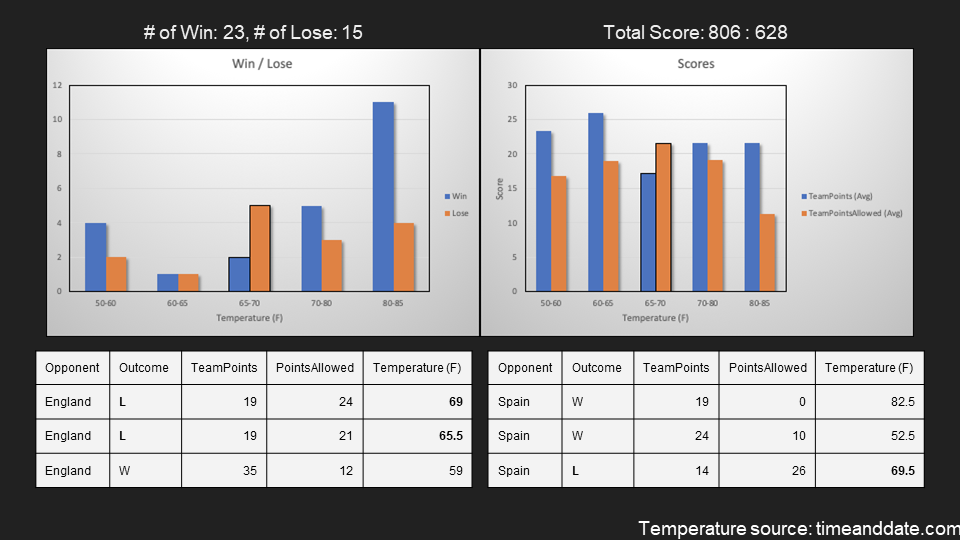
Best Use of Outside Data
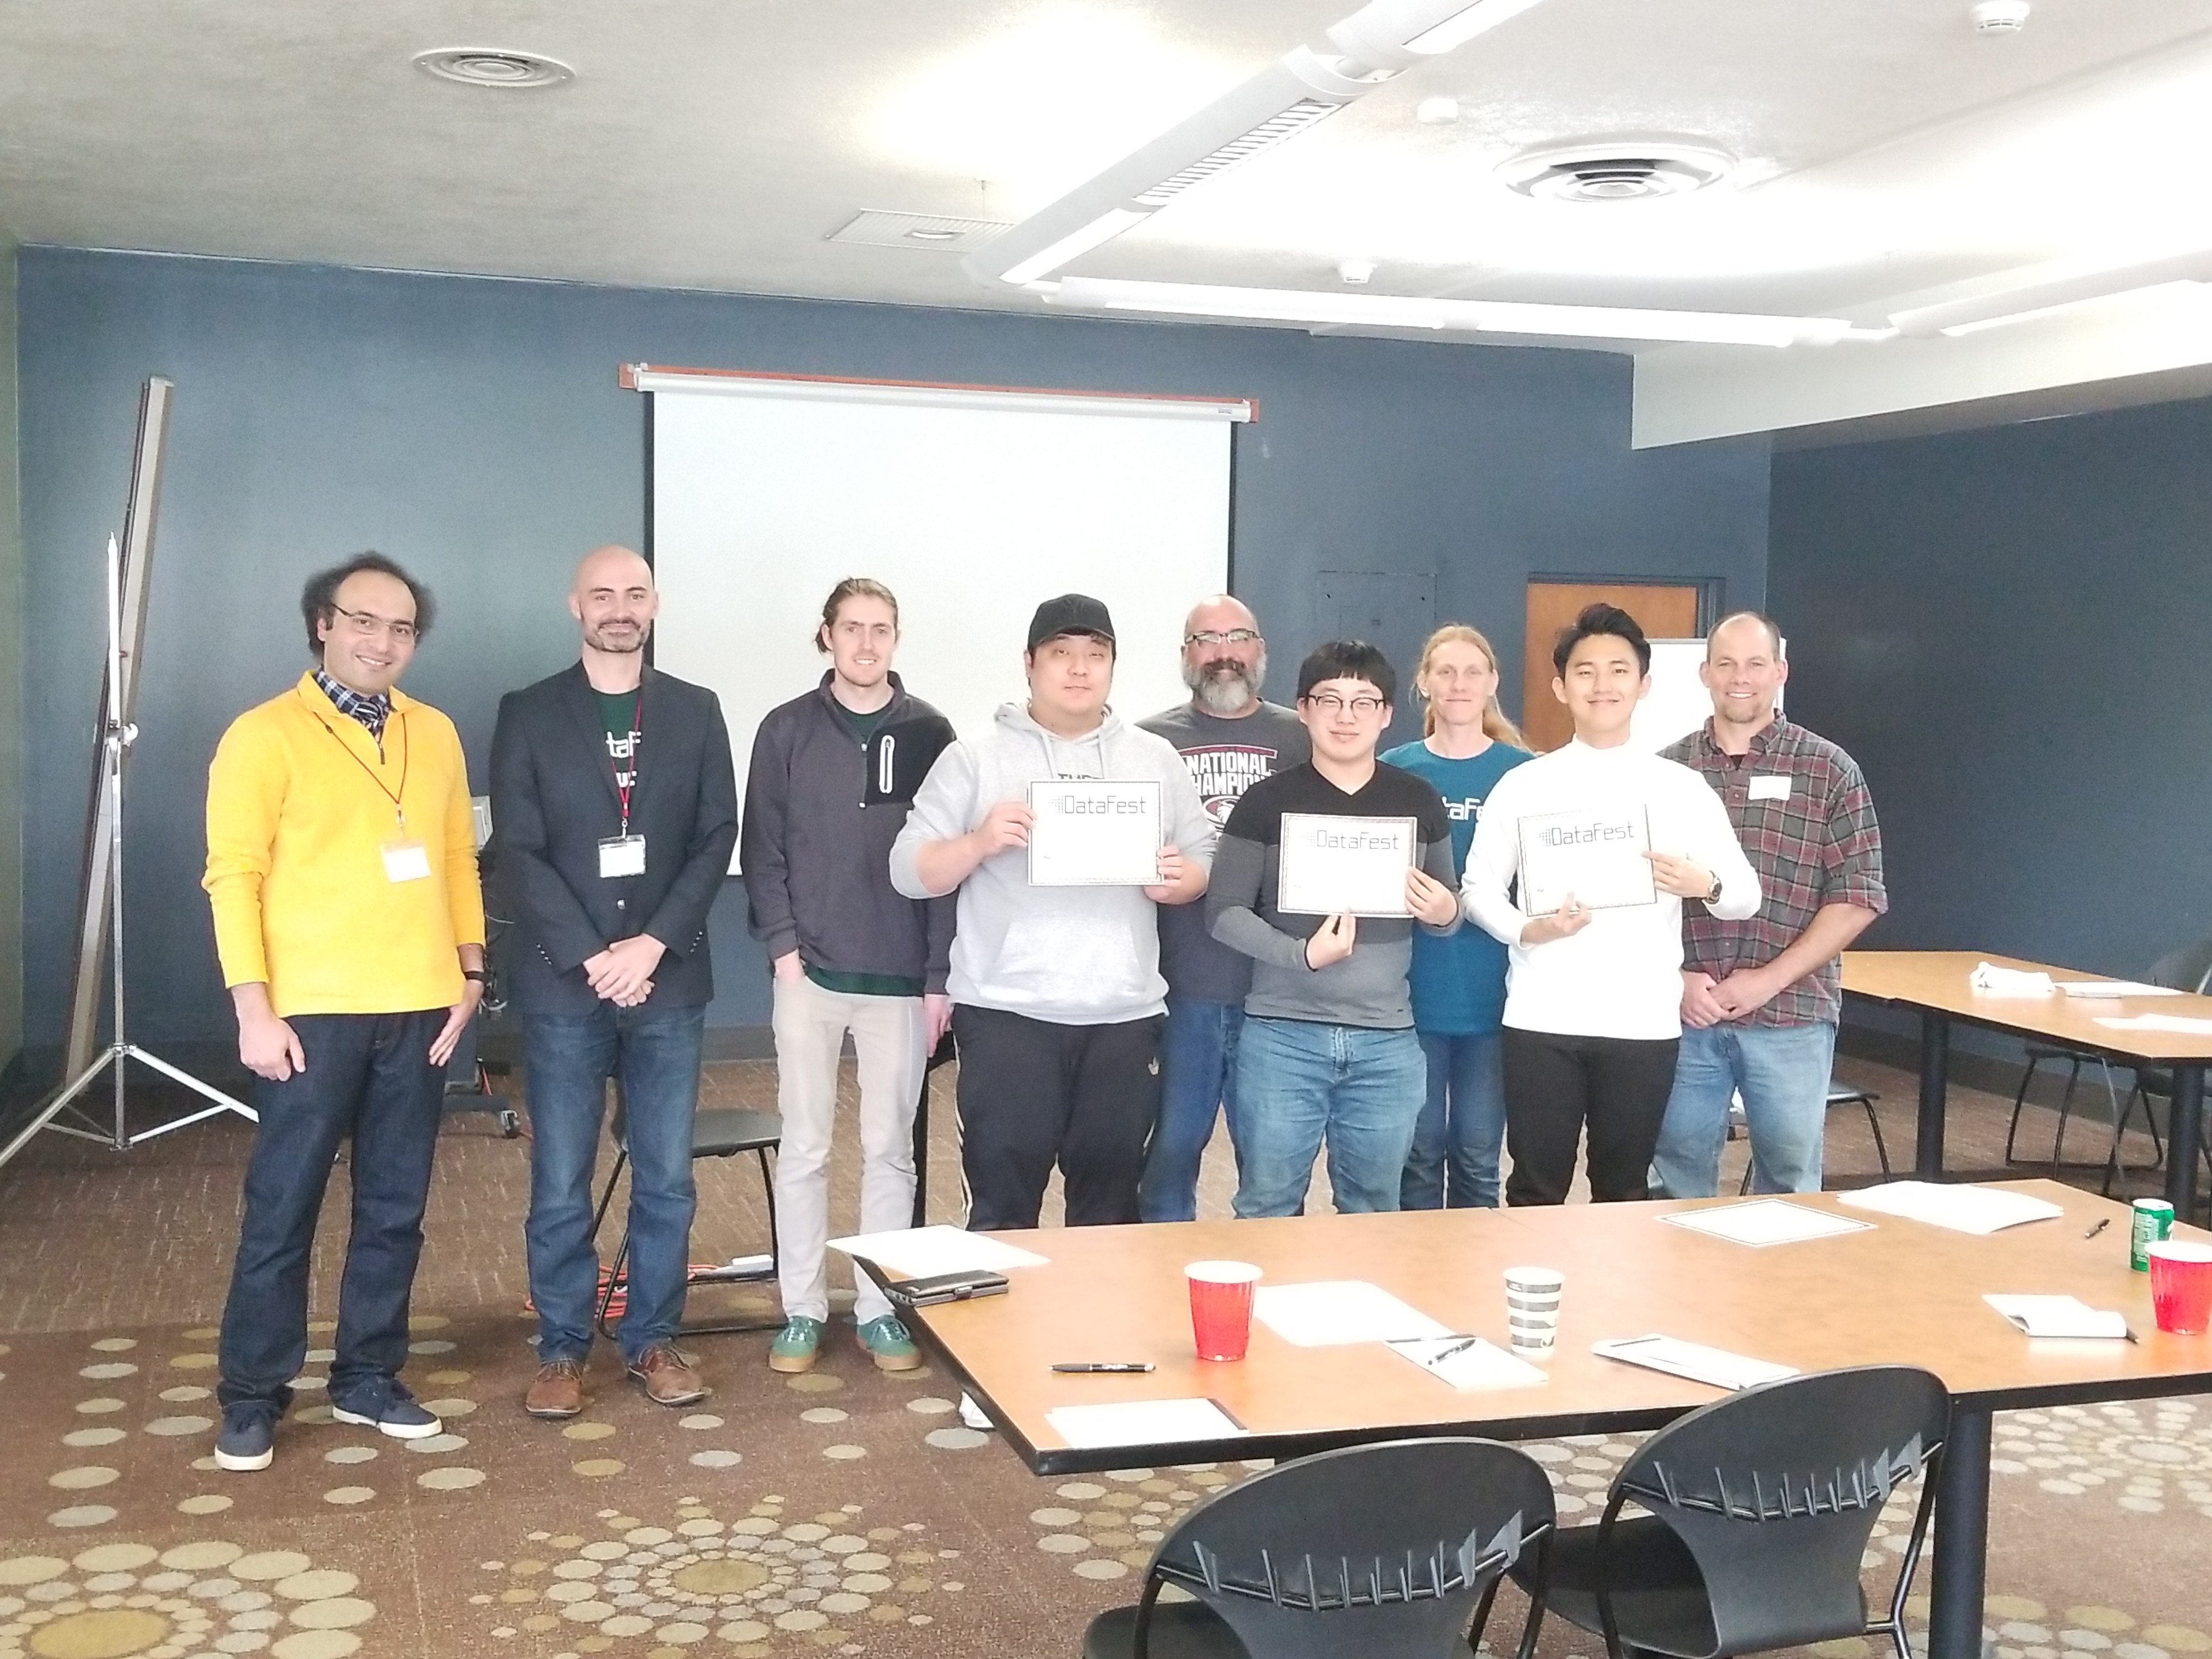 This team gathered weather data from an external website to analyze how weather patterns such as temperature and precipitation affected the team performance. This team gathered weather data from an external website to analyze how weather patterns such as temperature and precipitation affected the team performance.
|
|
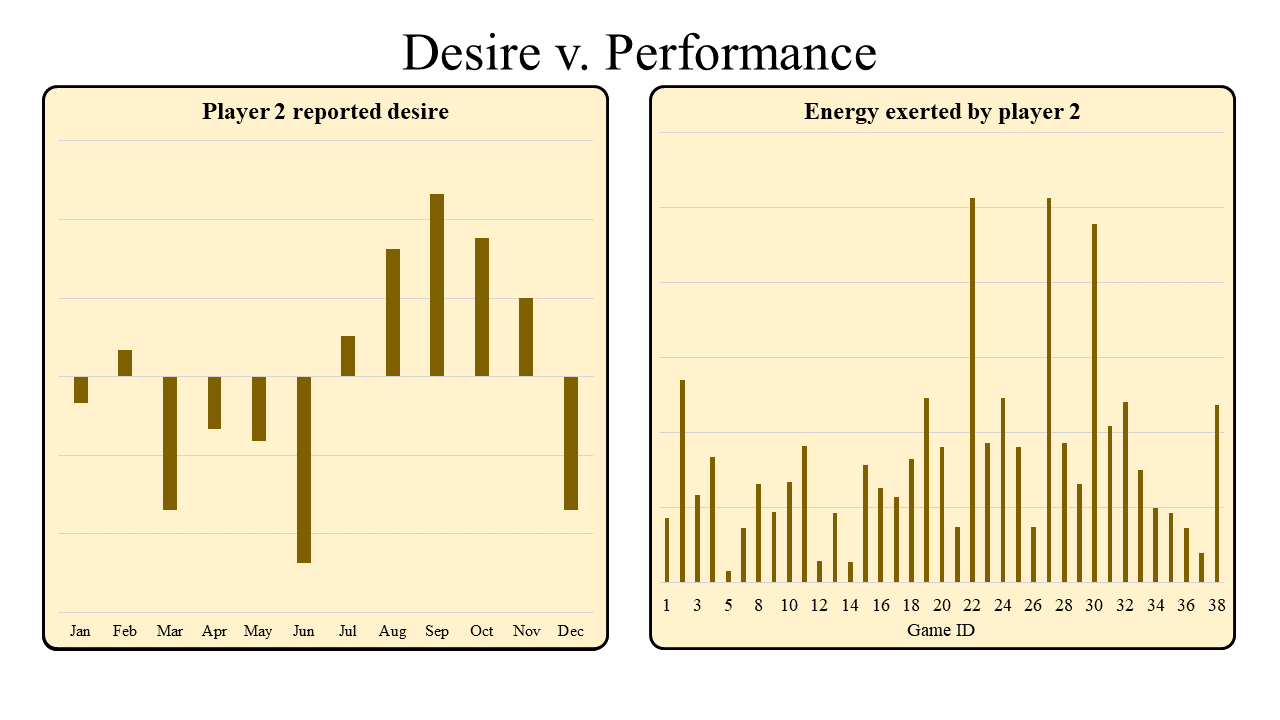
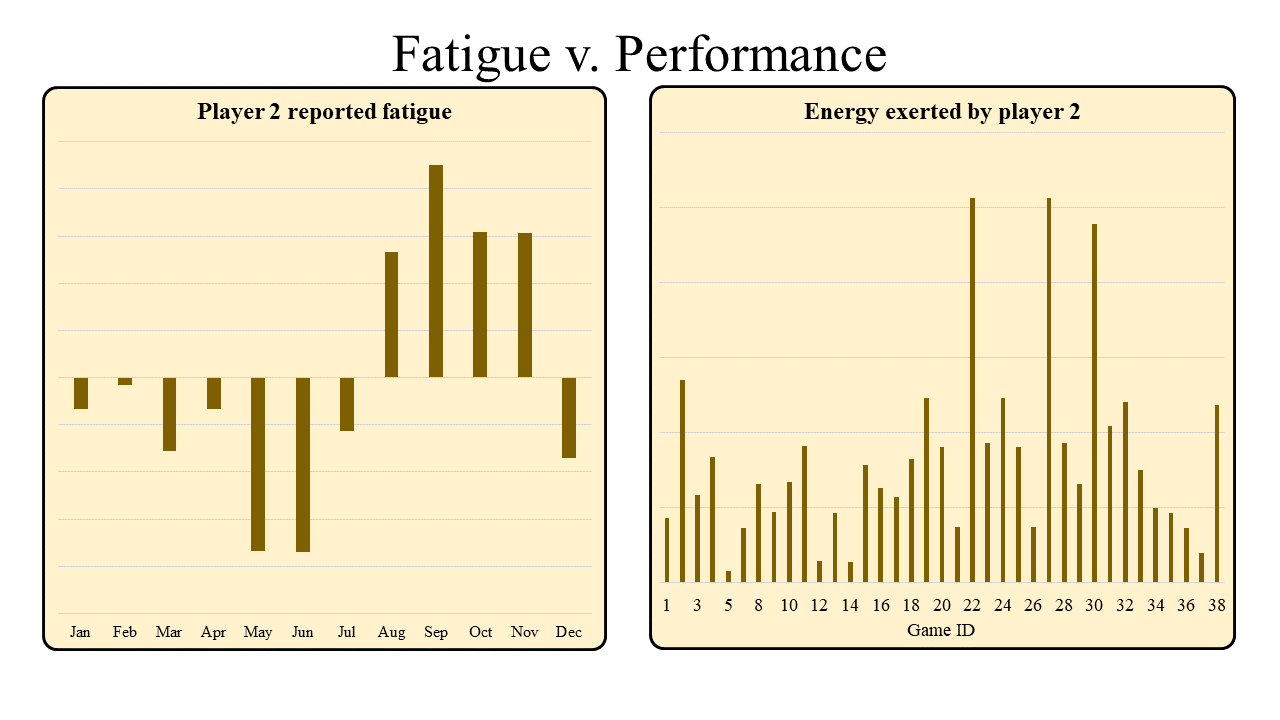
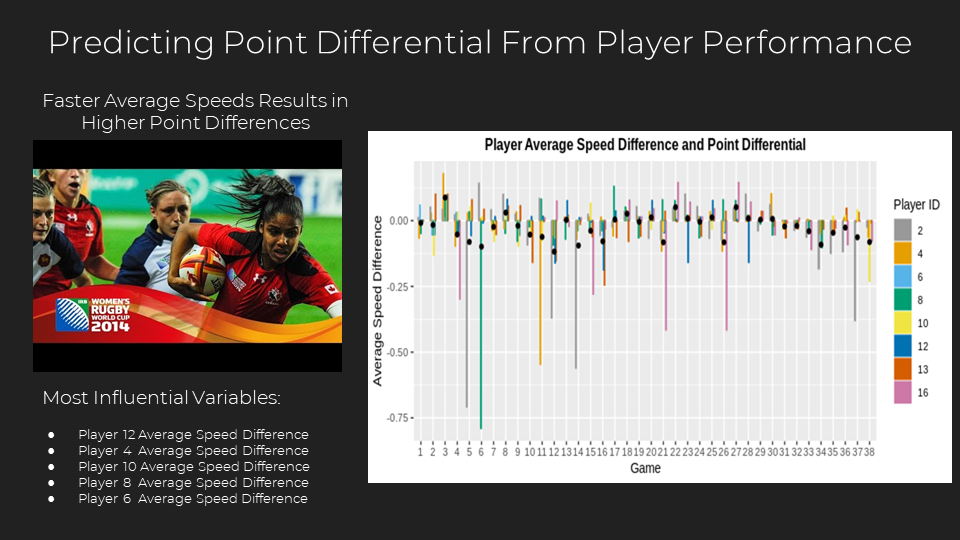
Best Visualization
 This team's visualizations conveyed their story in the most informative manner.
|
|
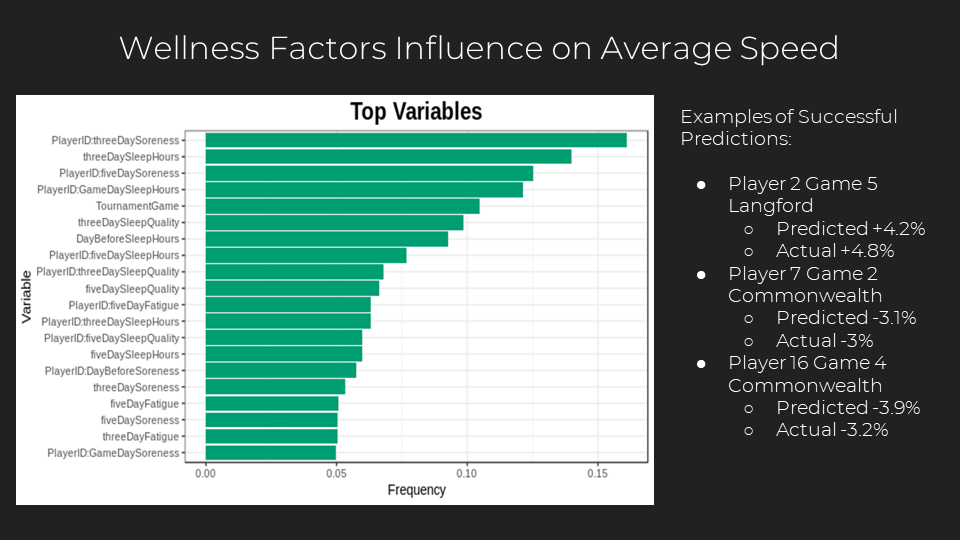
Best Discovery
 This team used multiple levels of statistical models to identify the negative impact soreness has on player speed, which was also found to be associated with overall team performance in tournaments.
|
|
Judges Choice
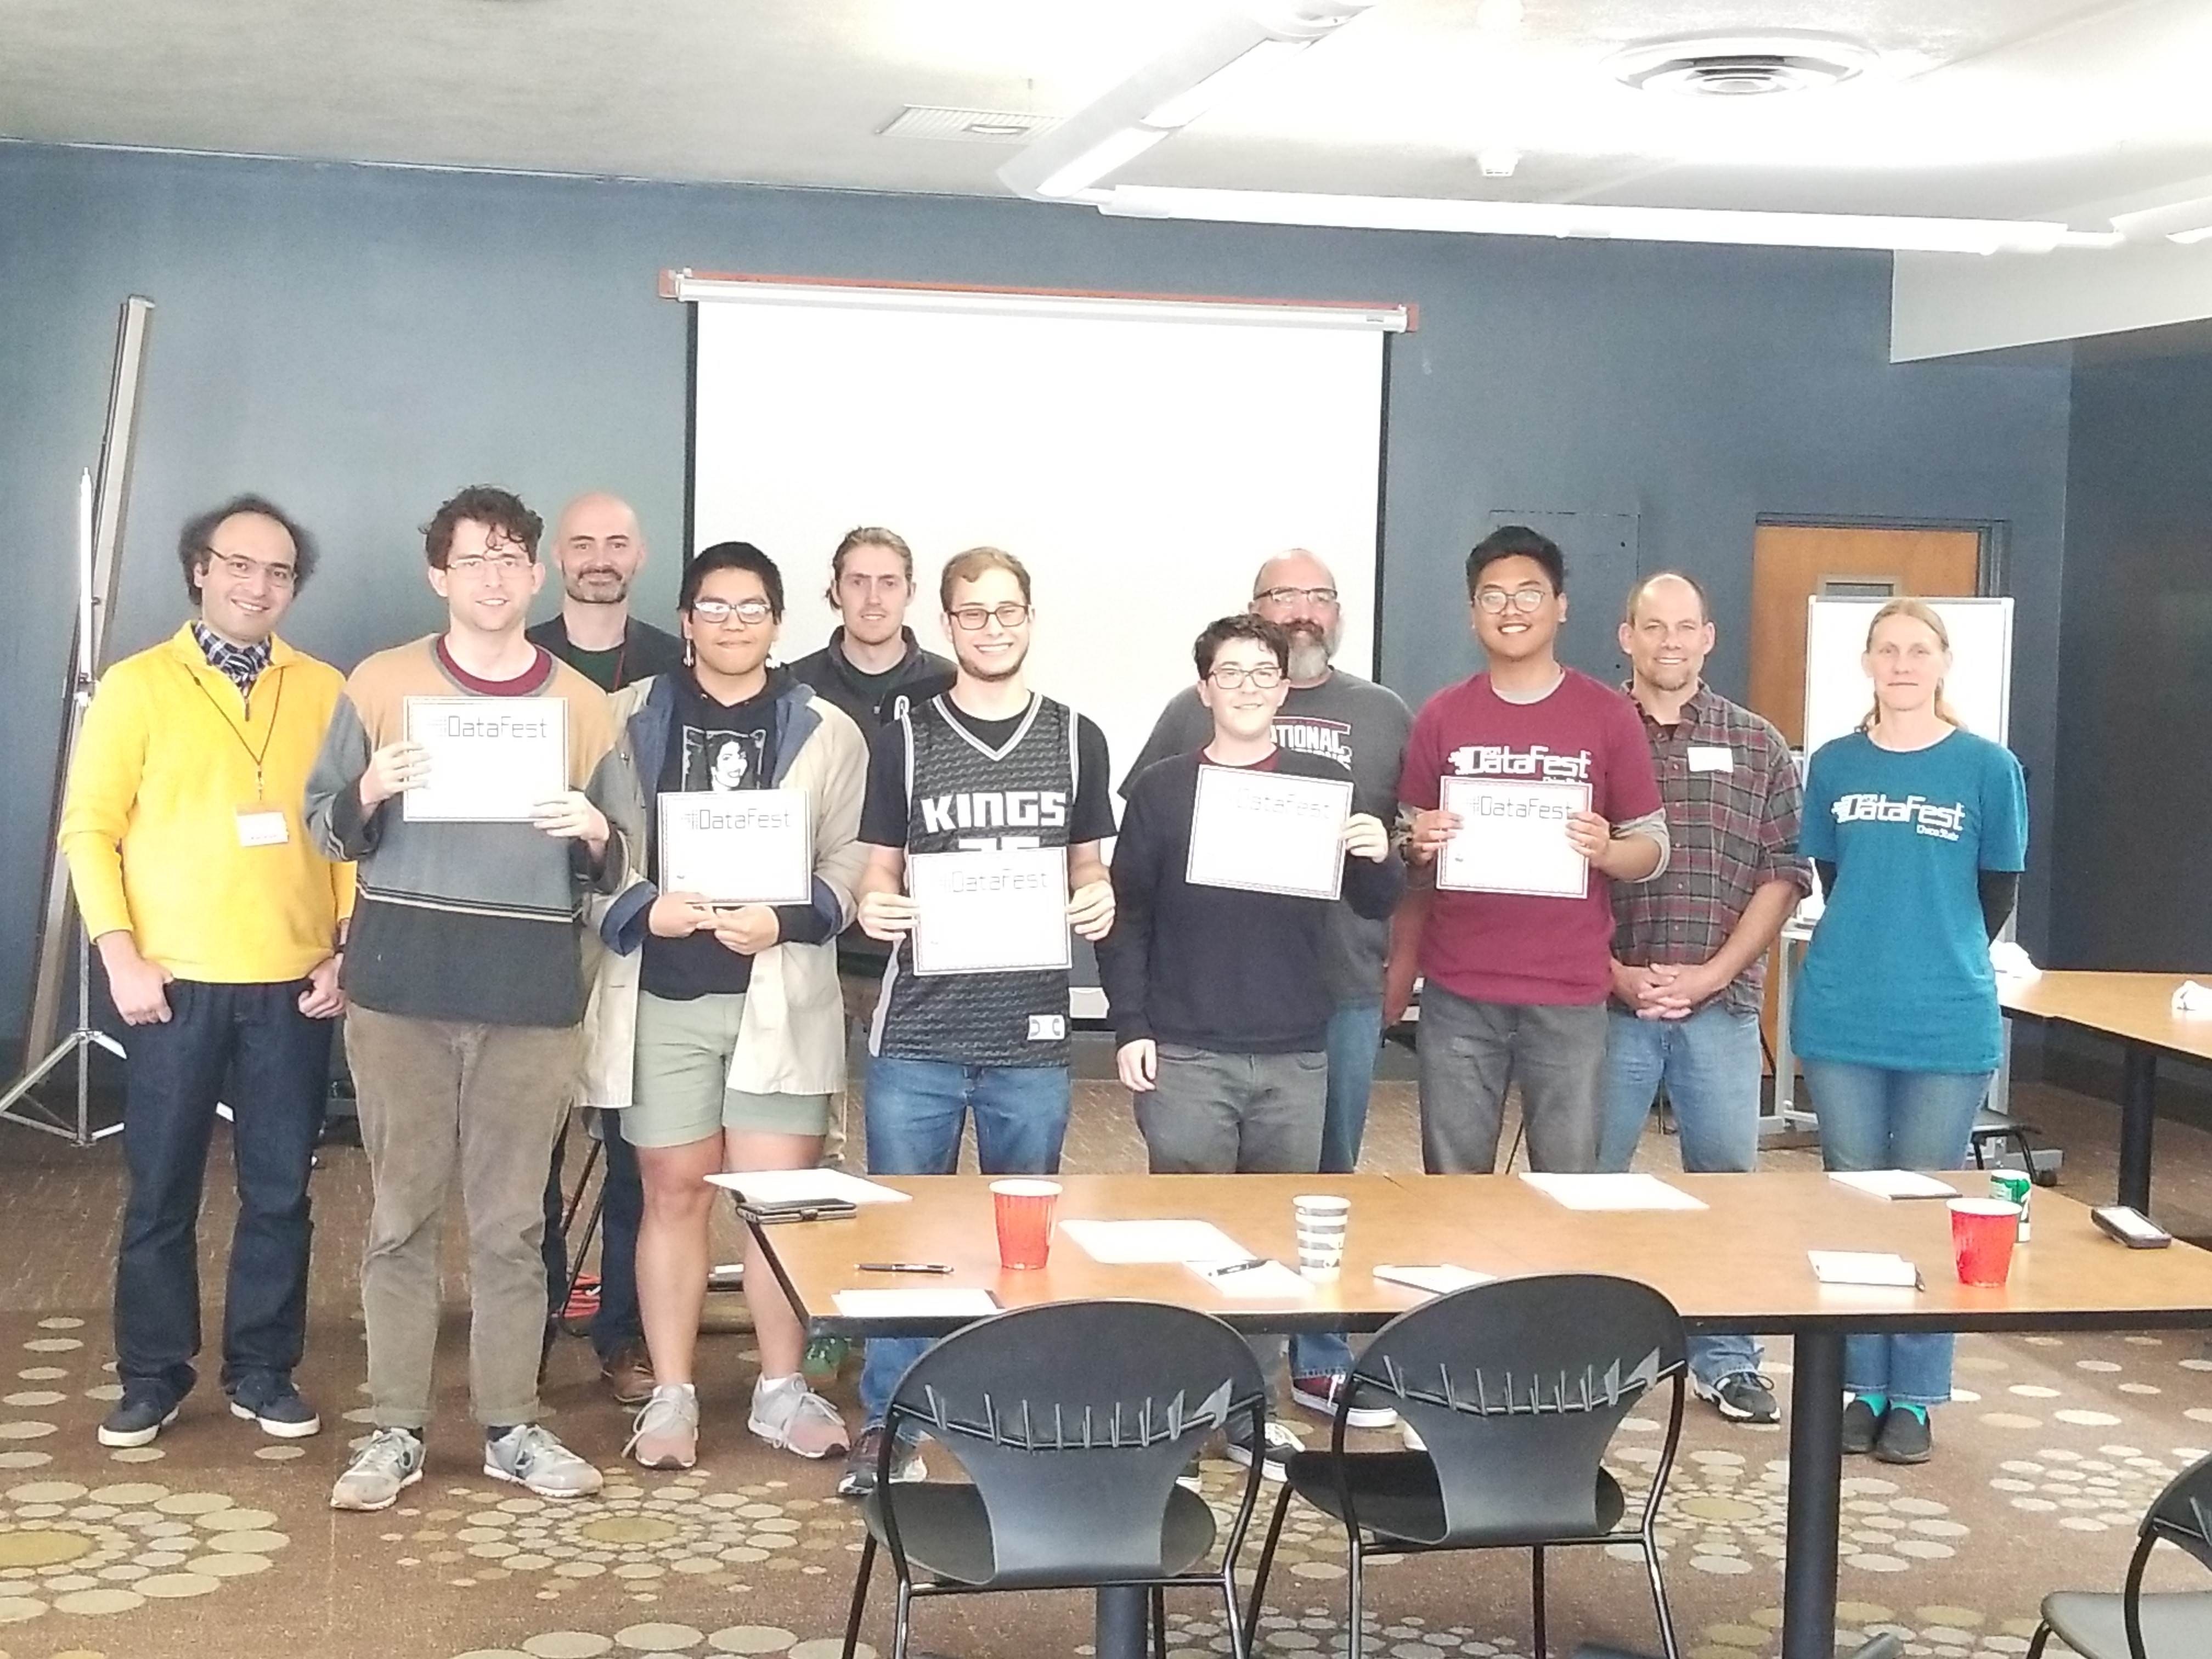 This team built an interactive application for coaches to monitor their players performance and wellness.
|
See their video submission at
https://youtu.be/nwzyN3rt4yI
|
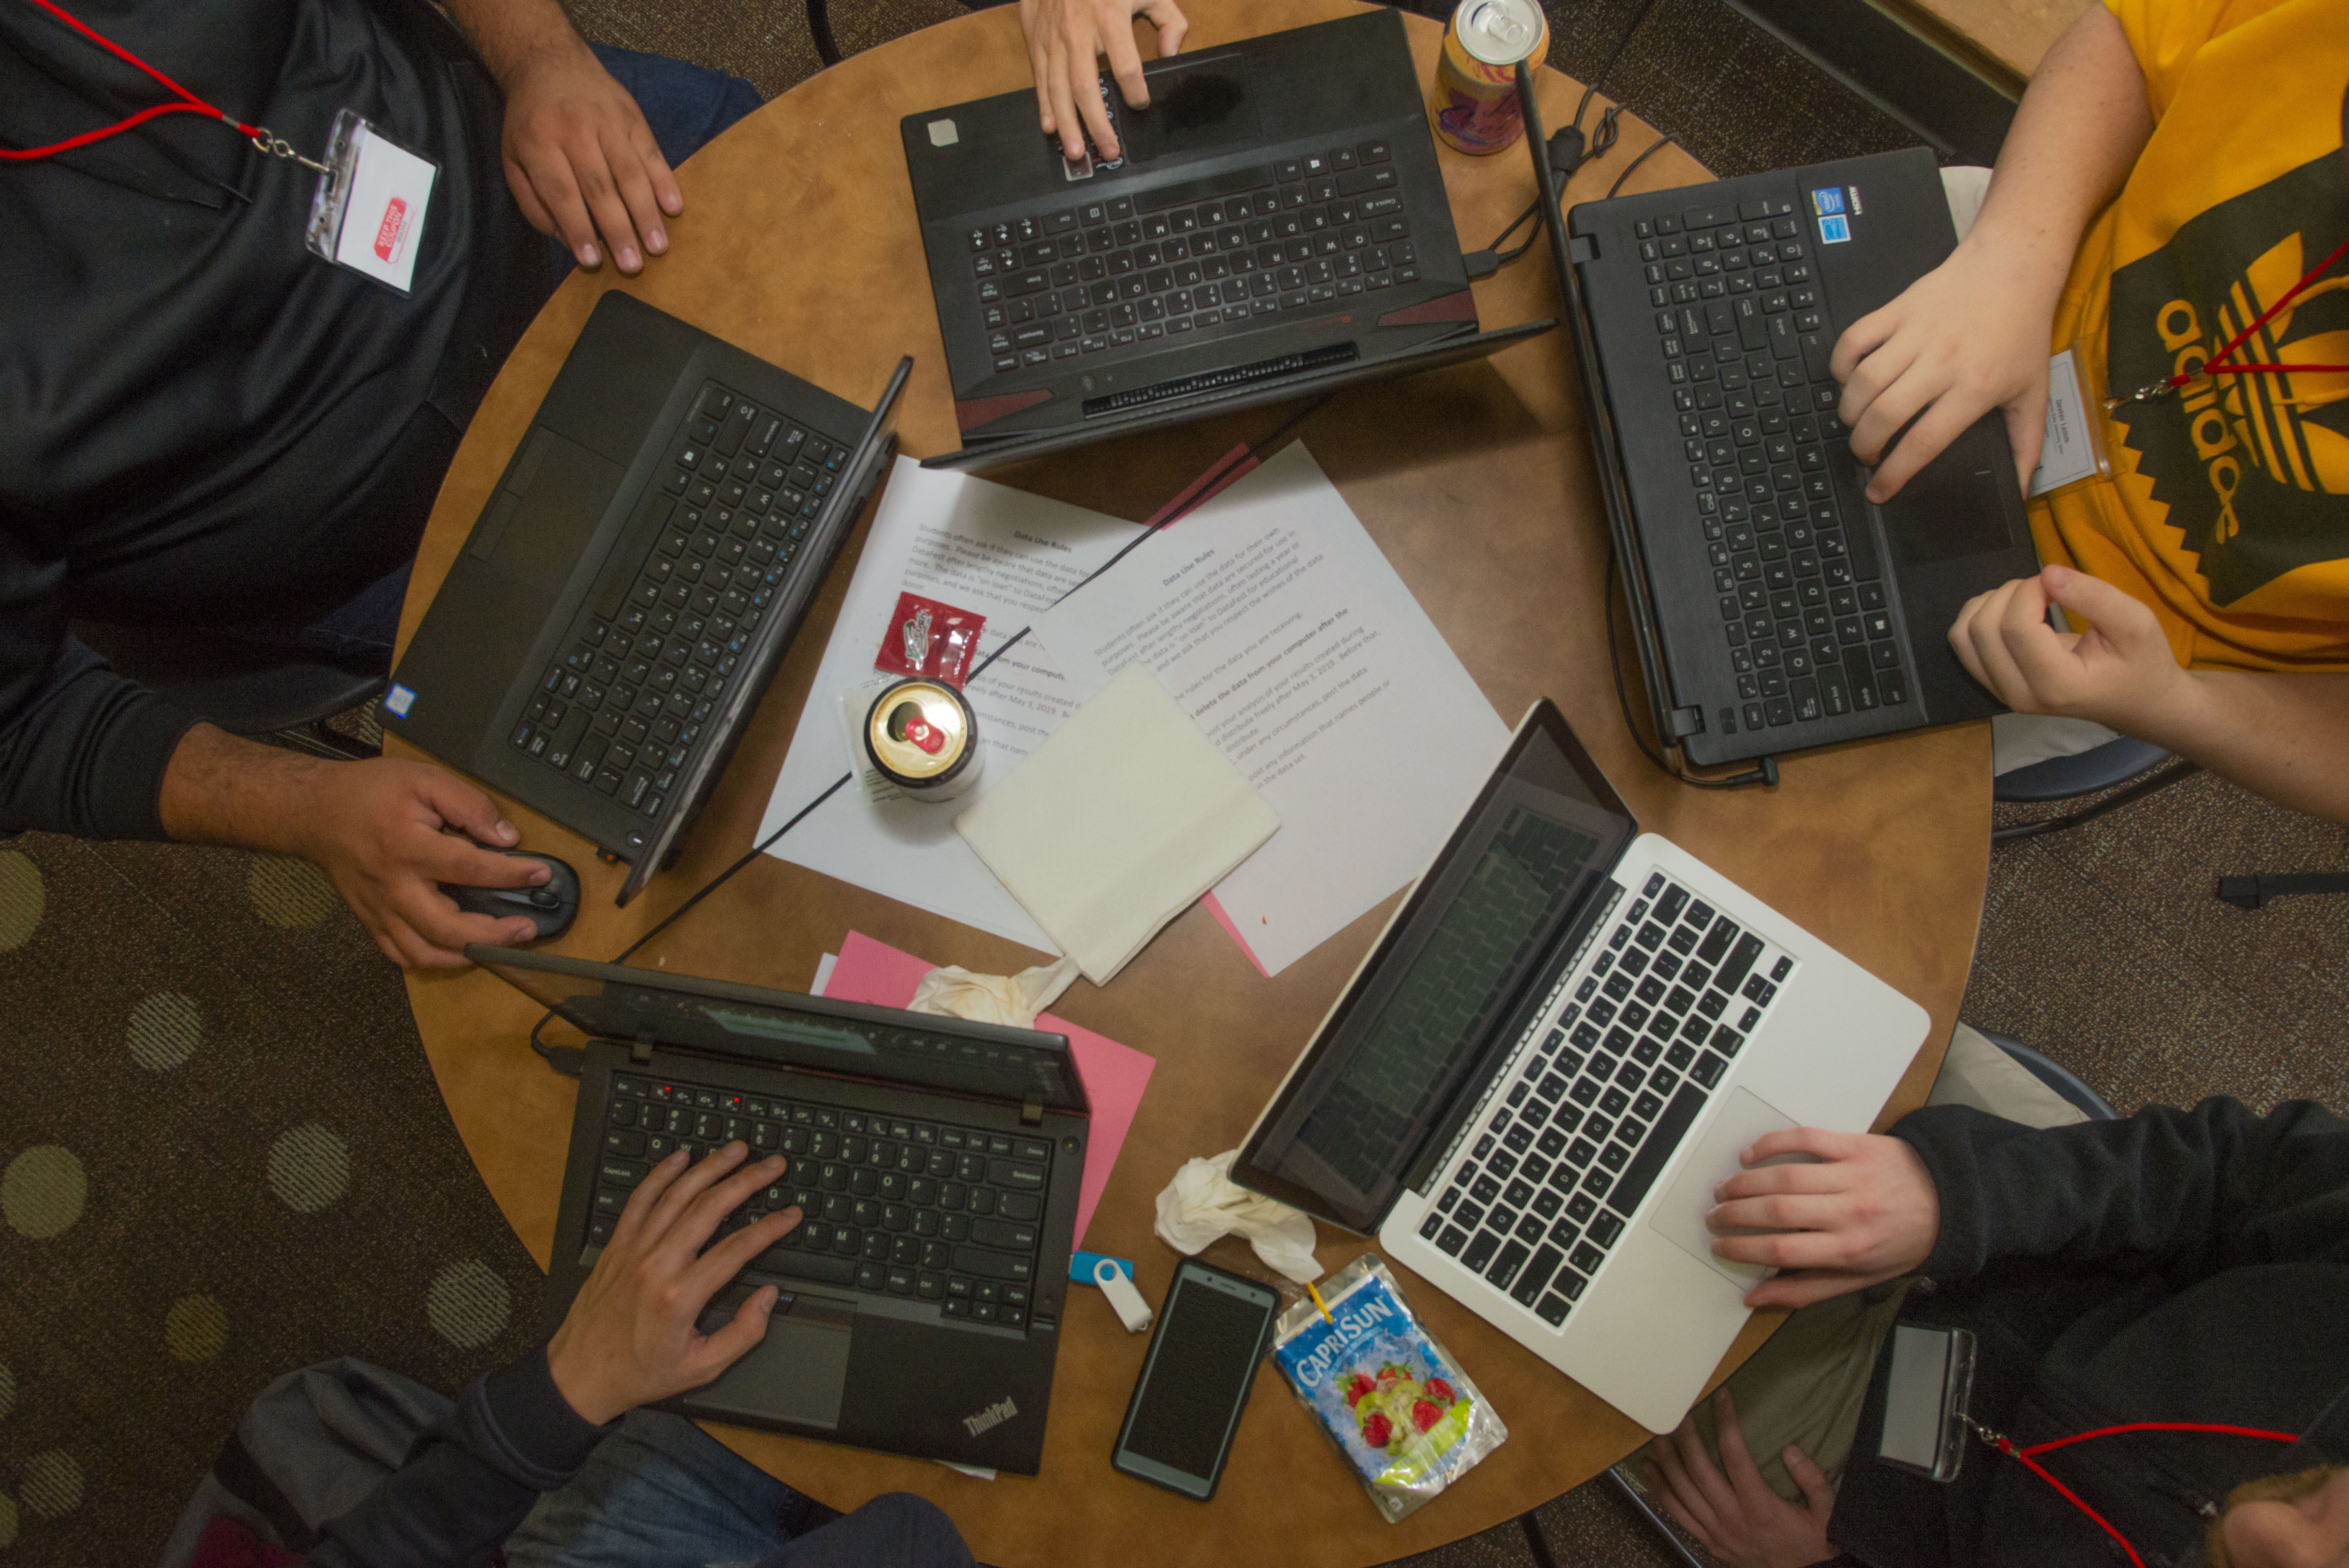
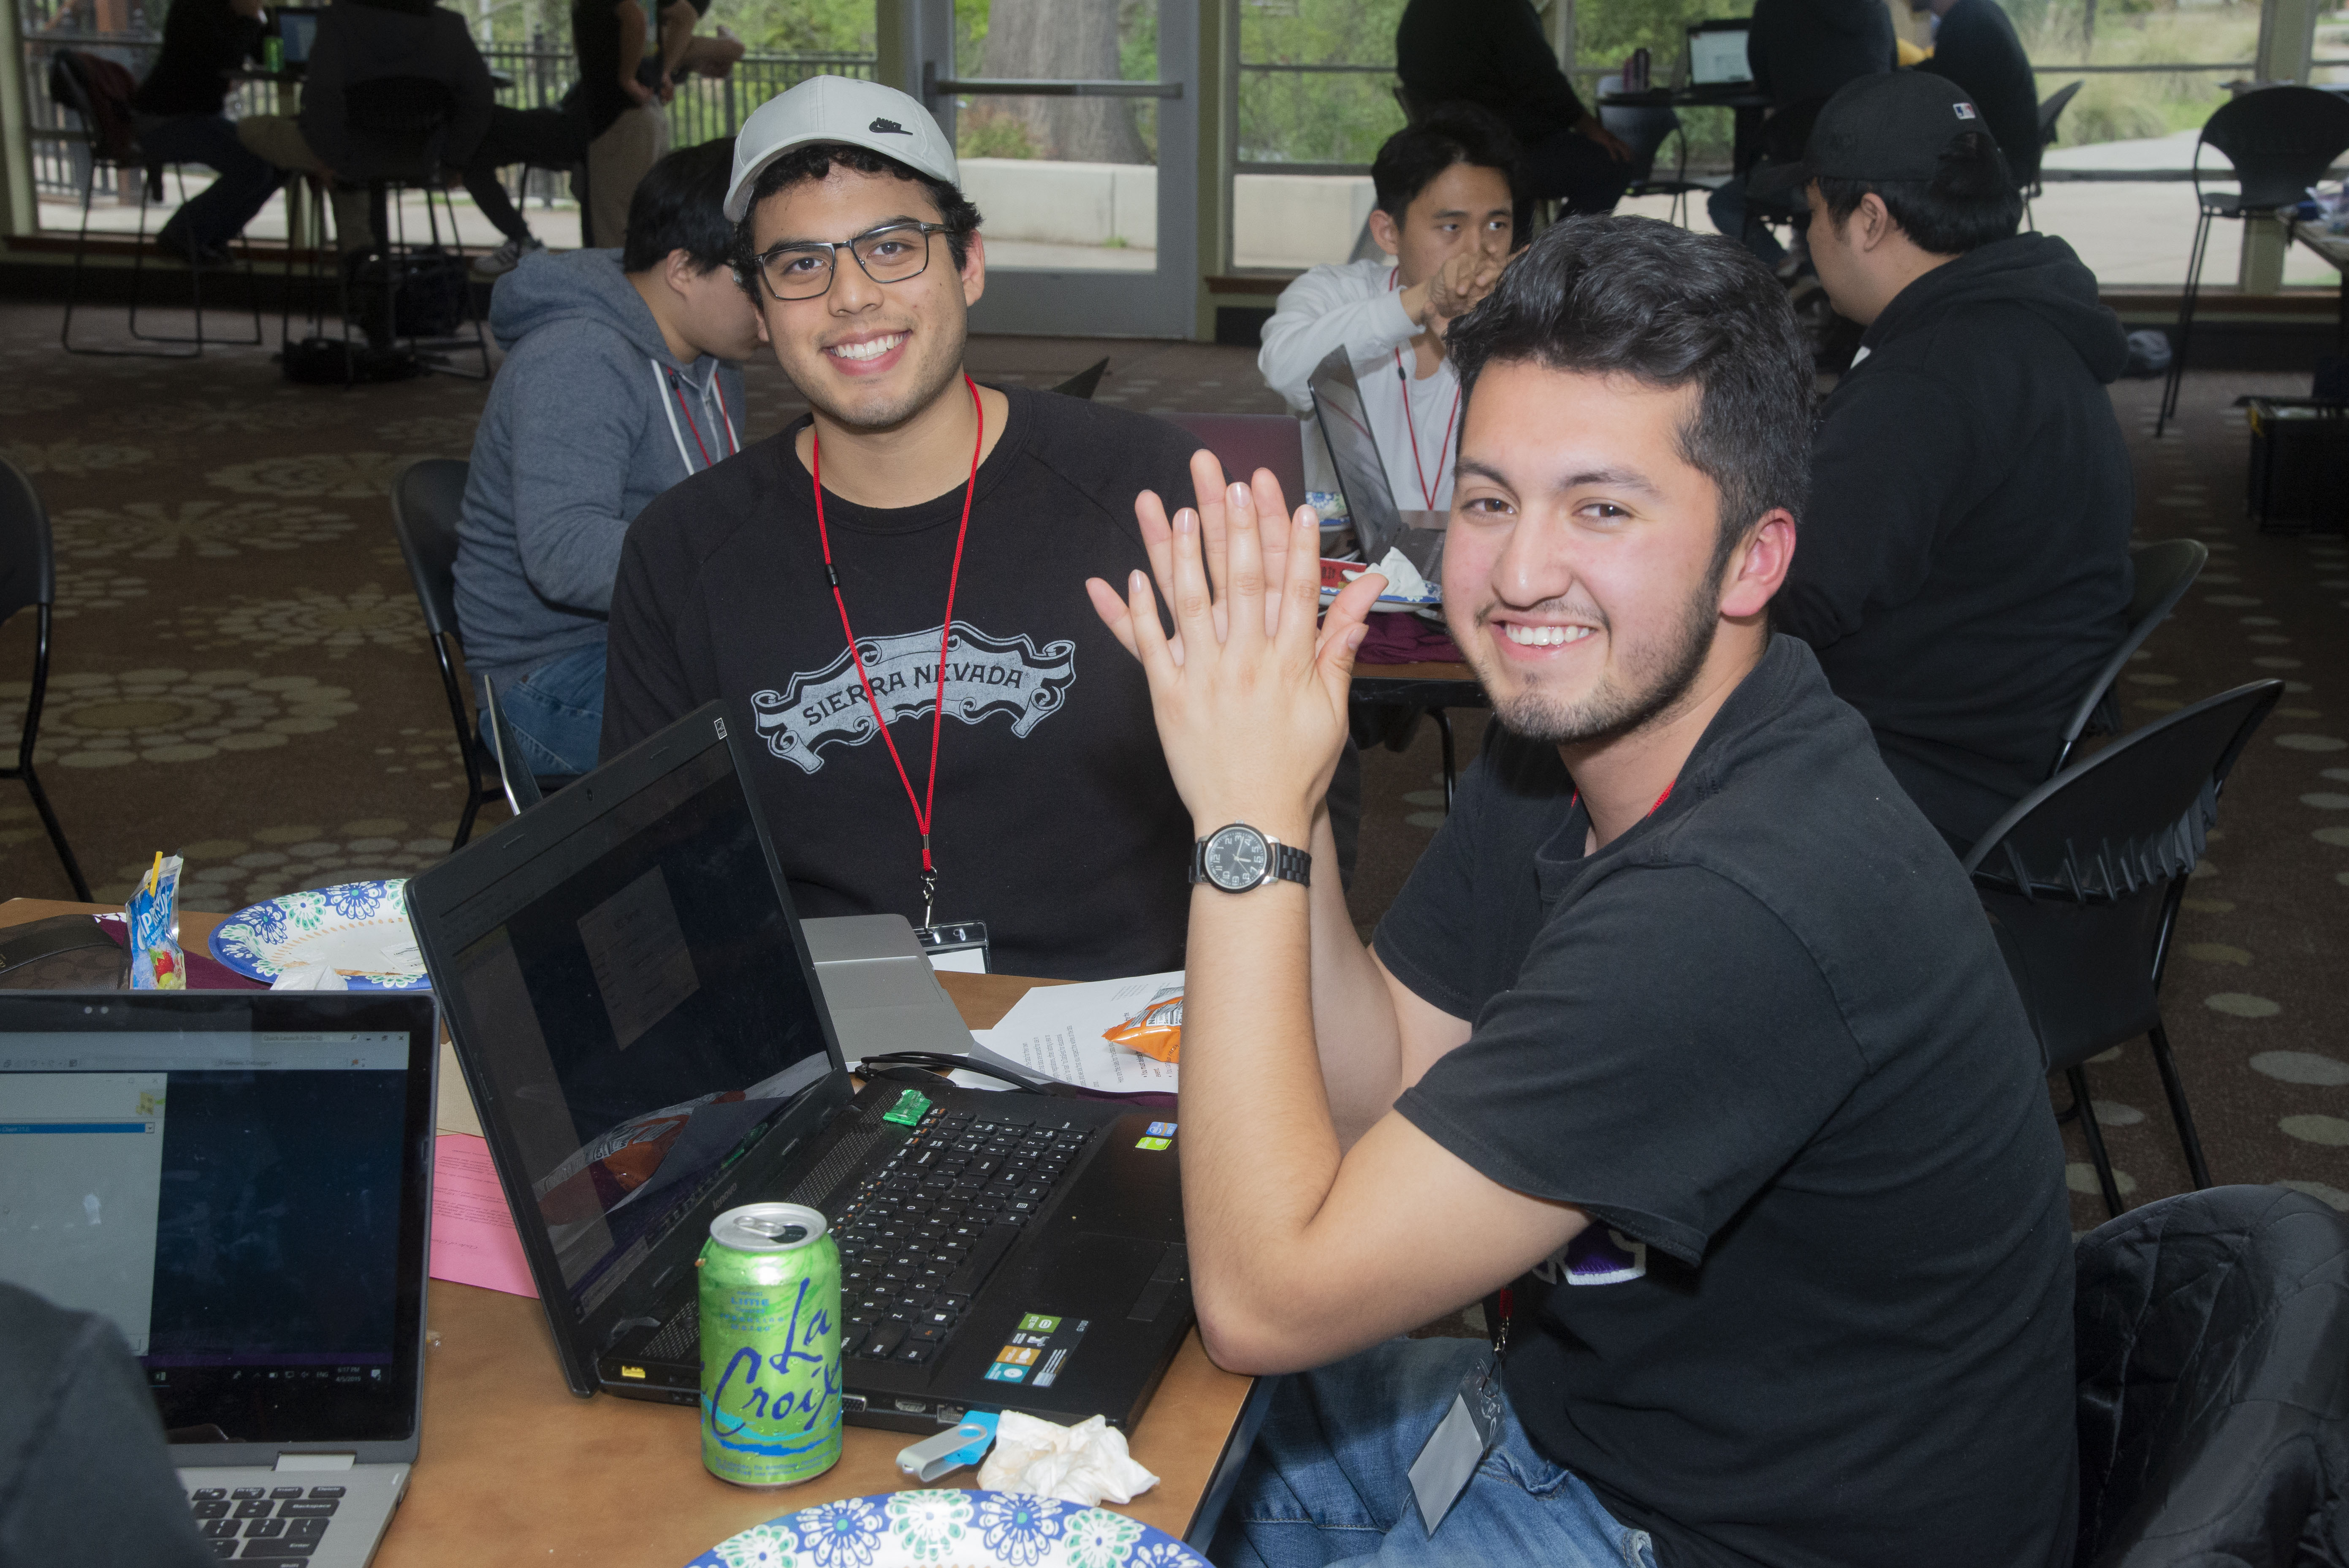
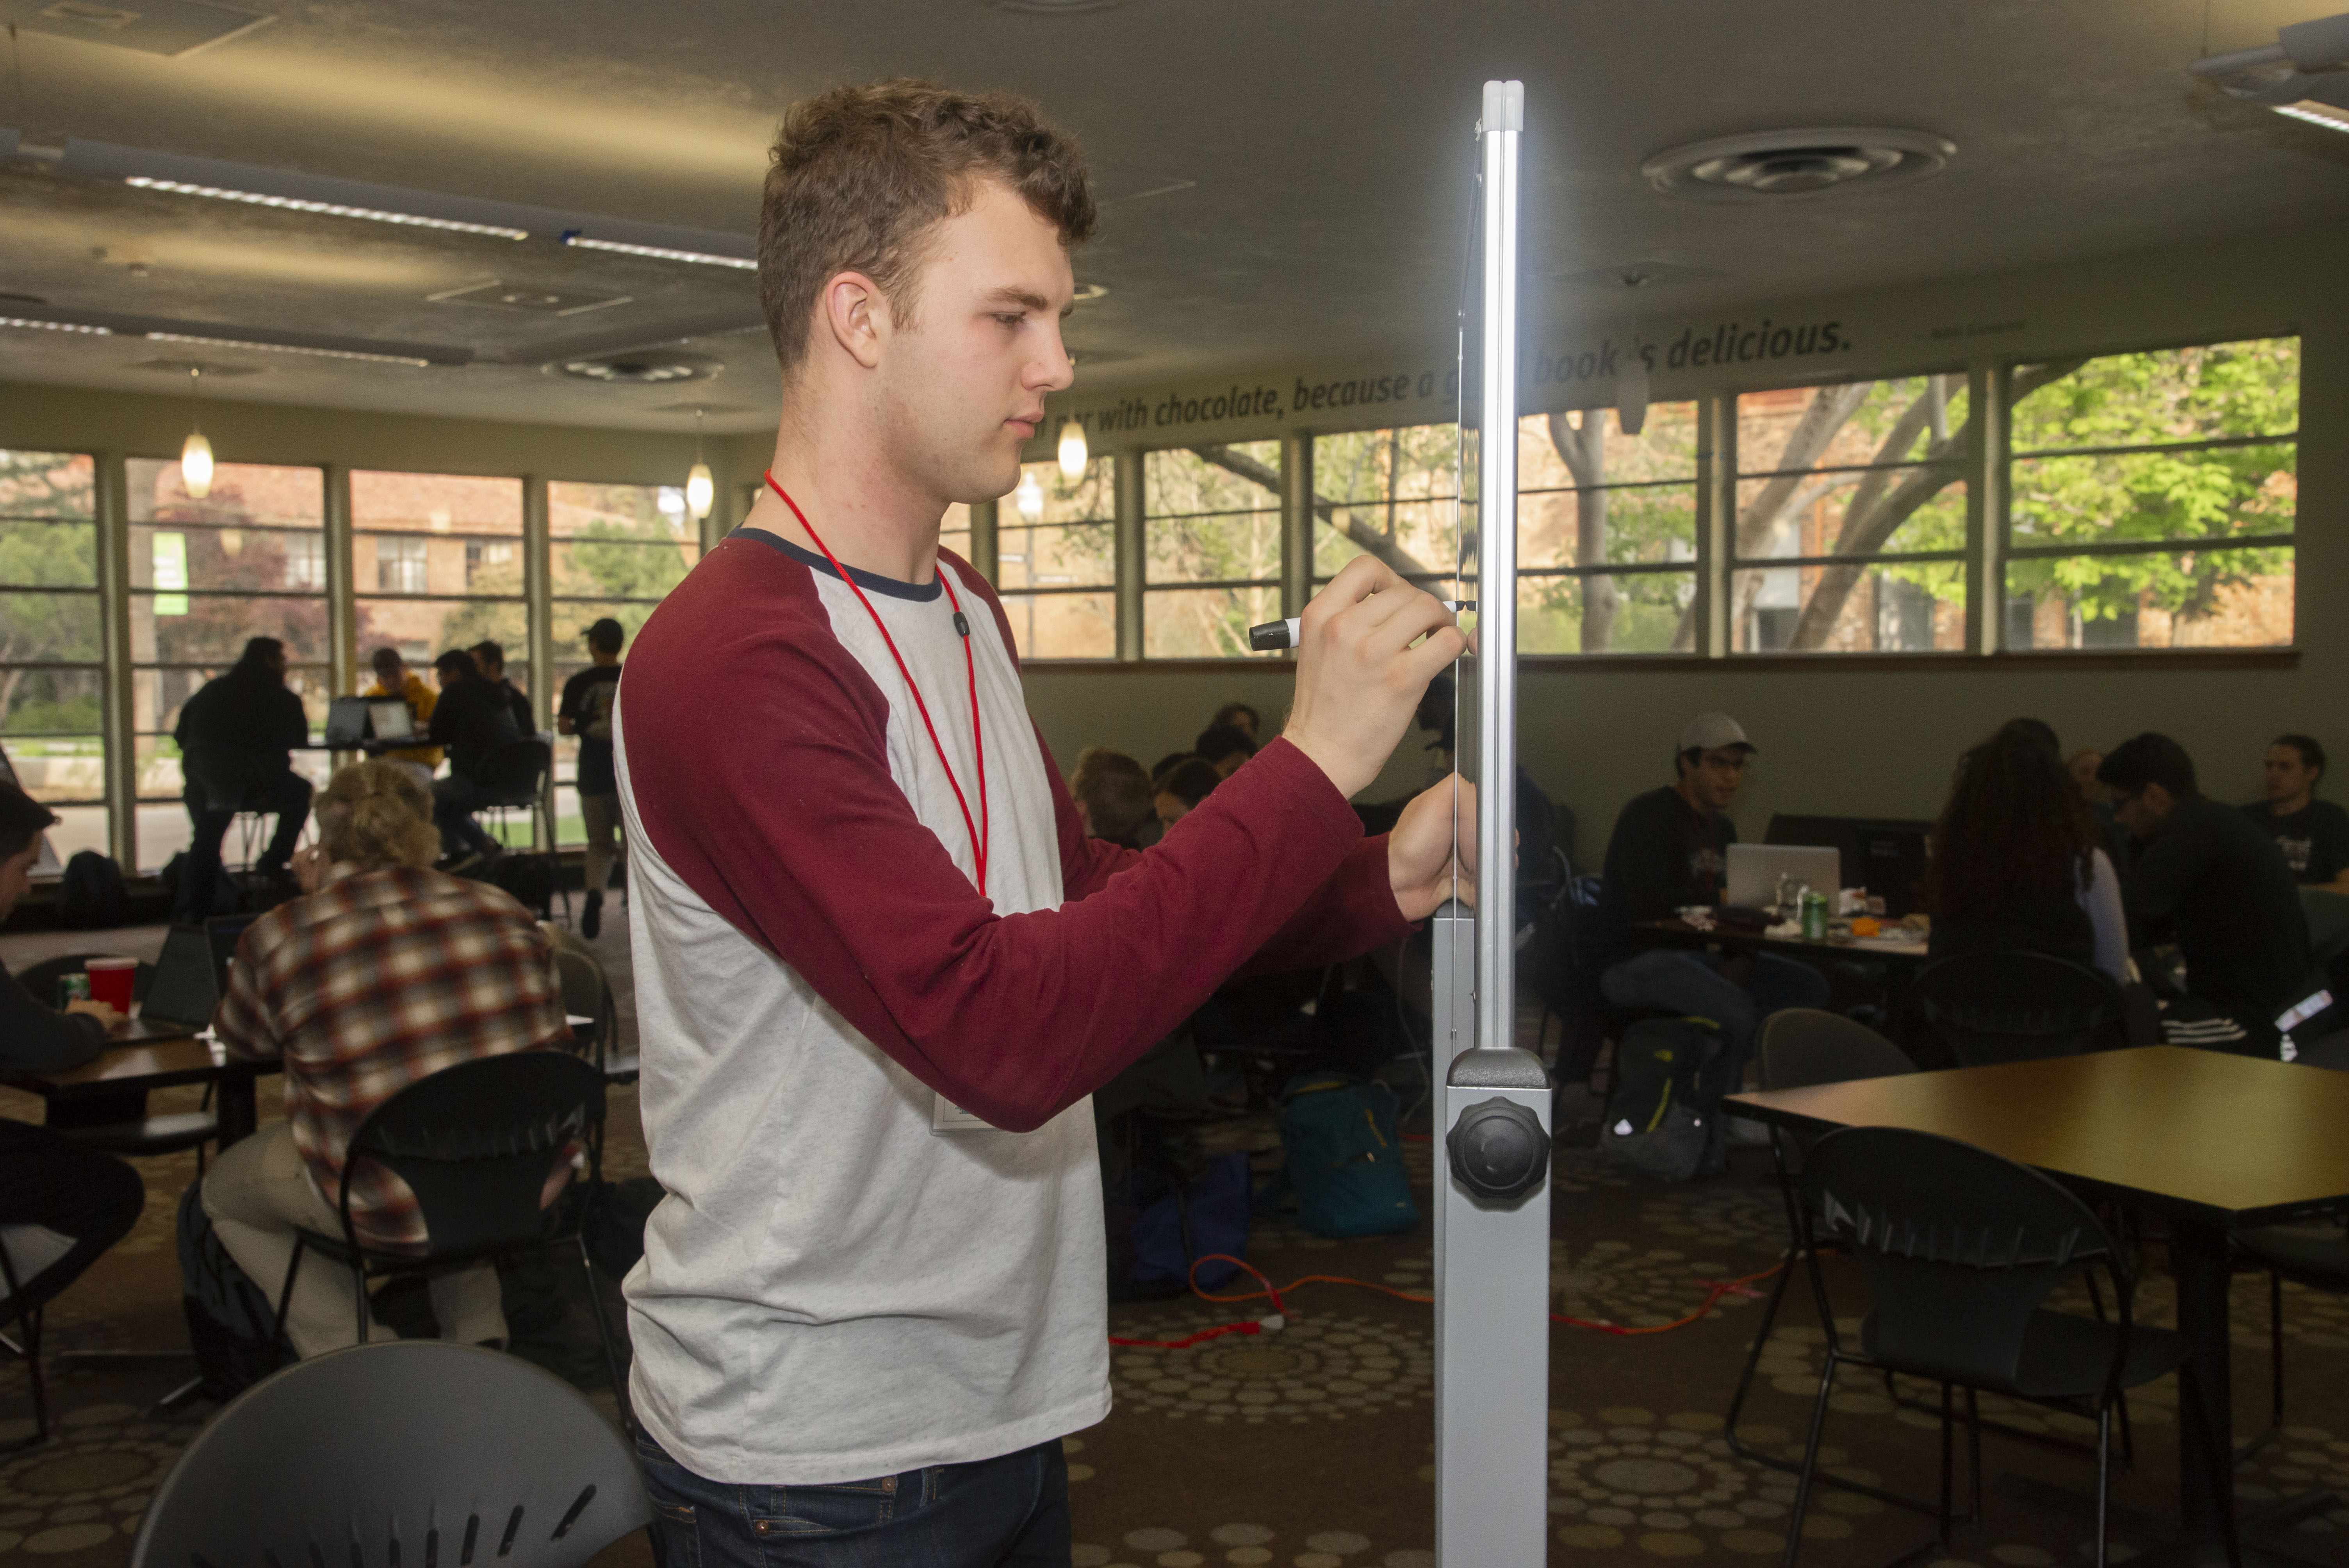
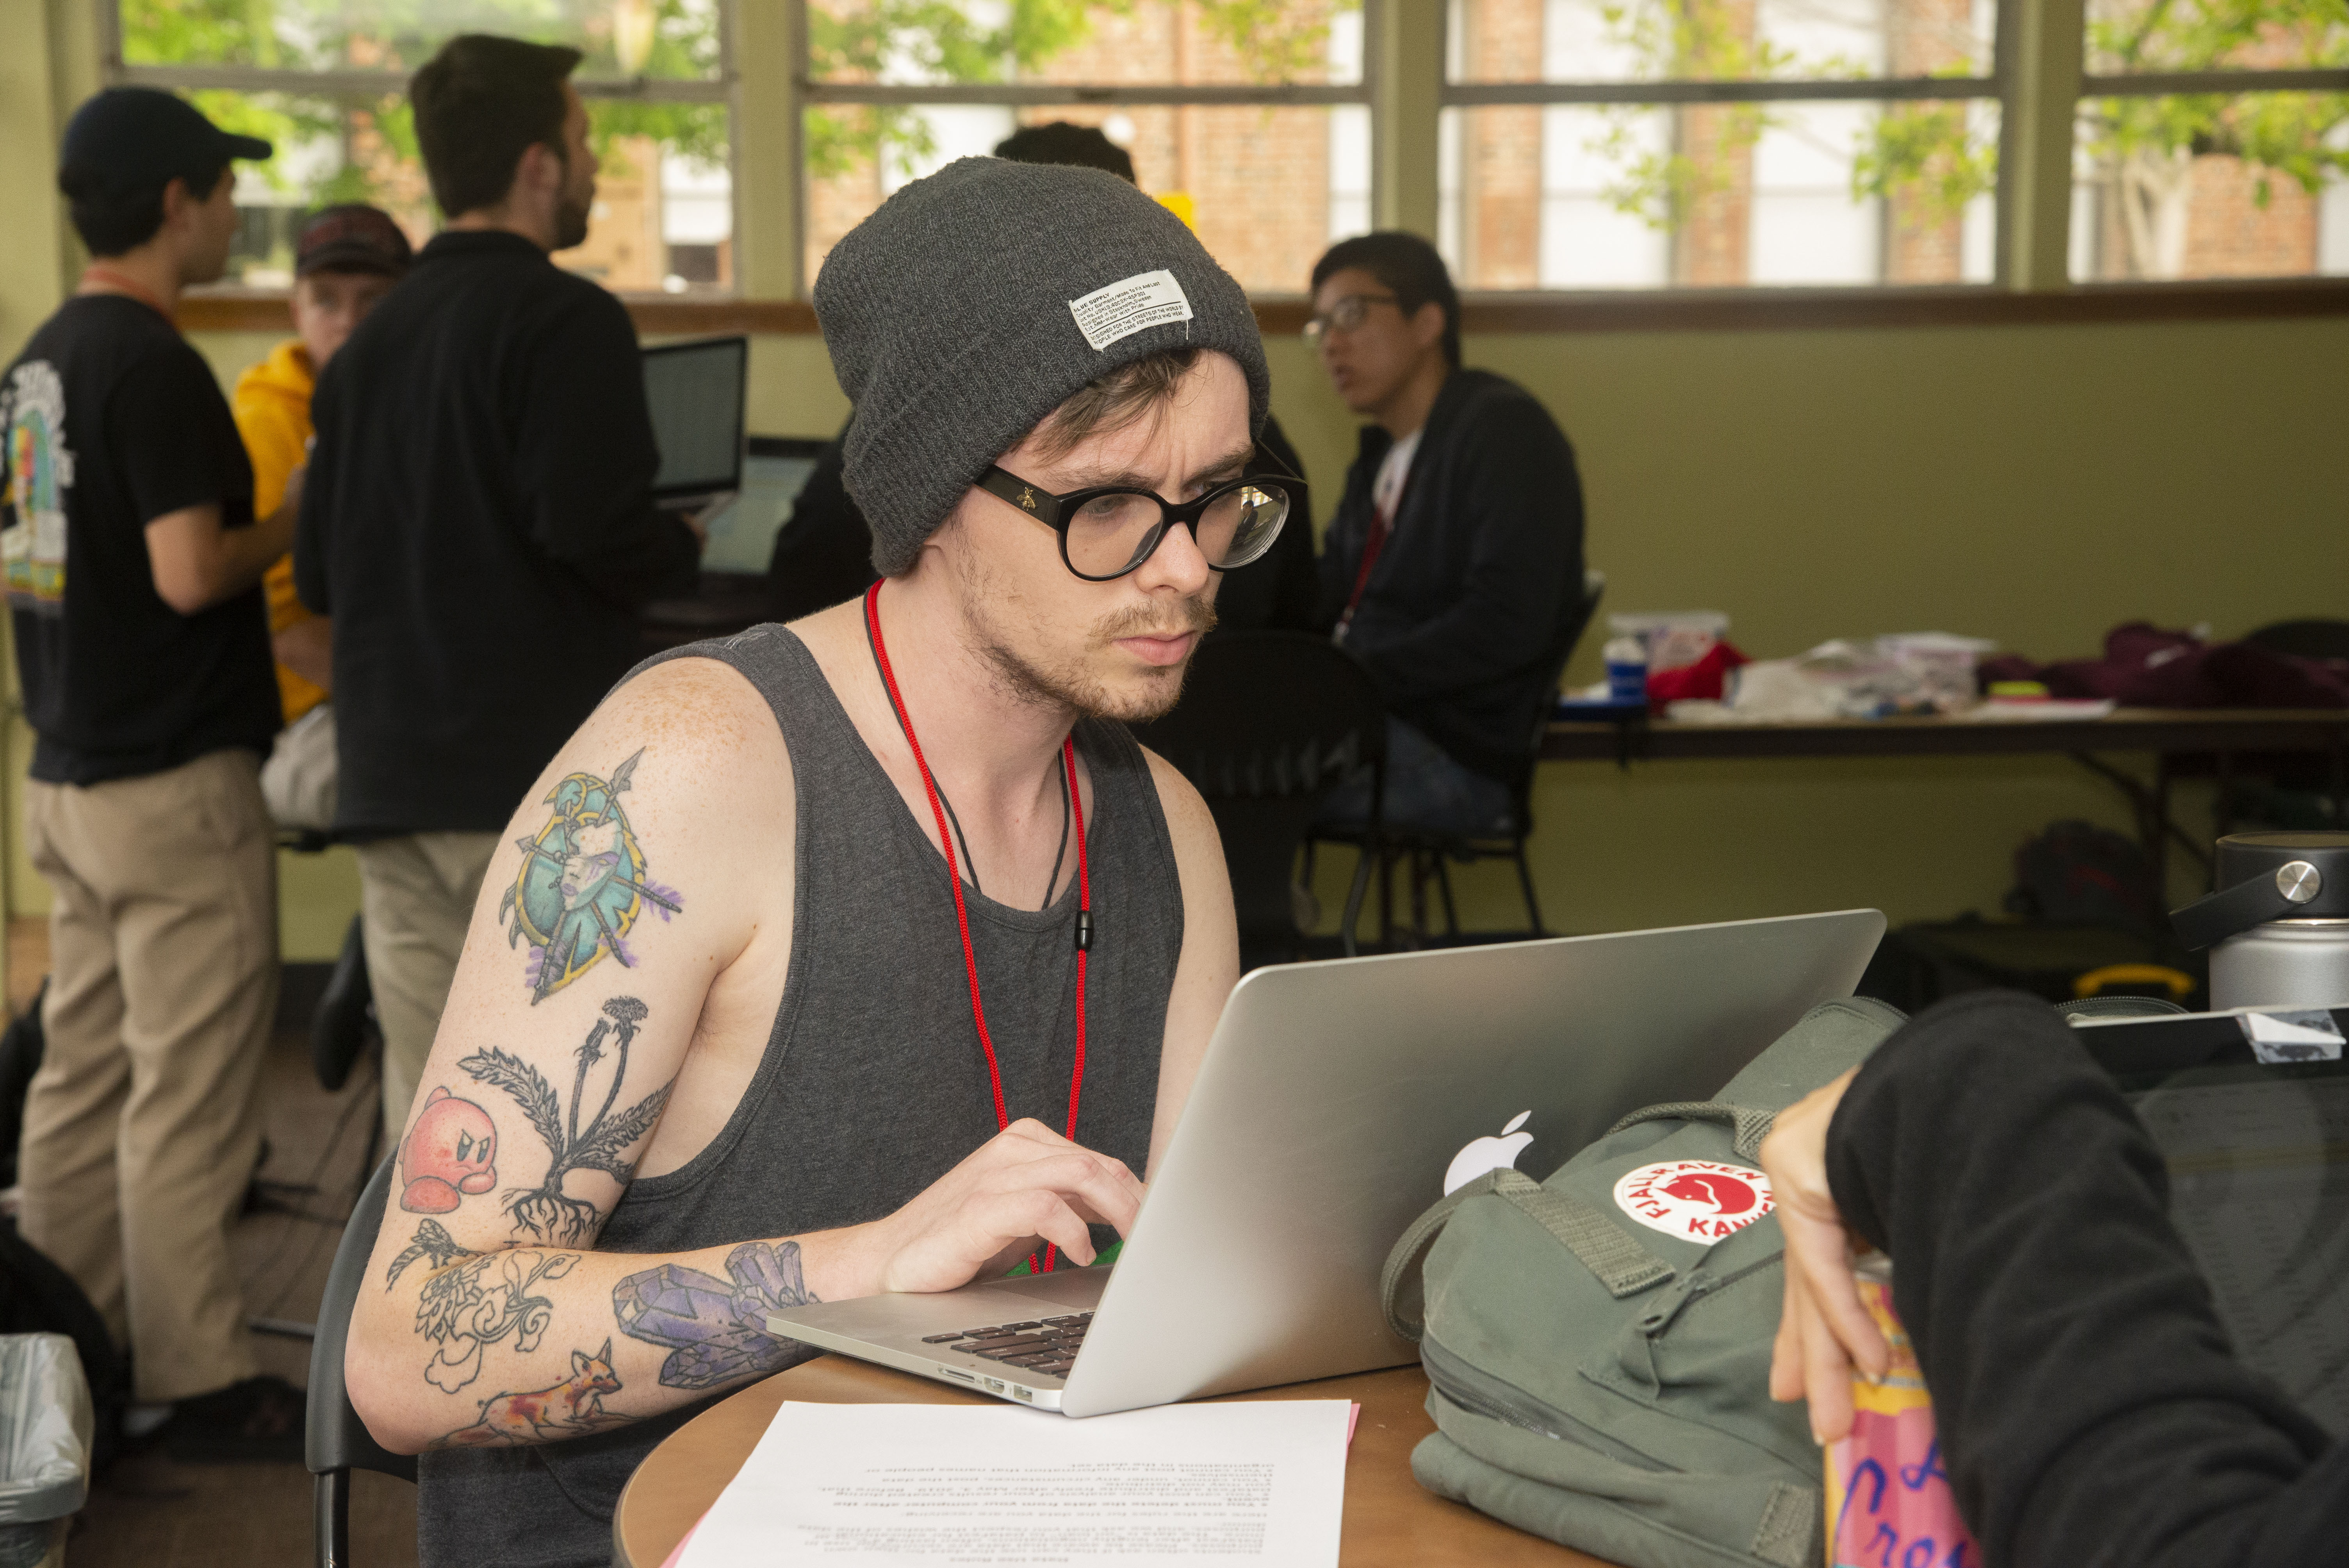
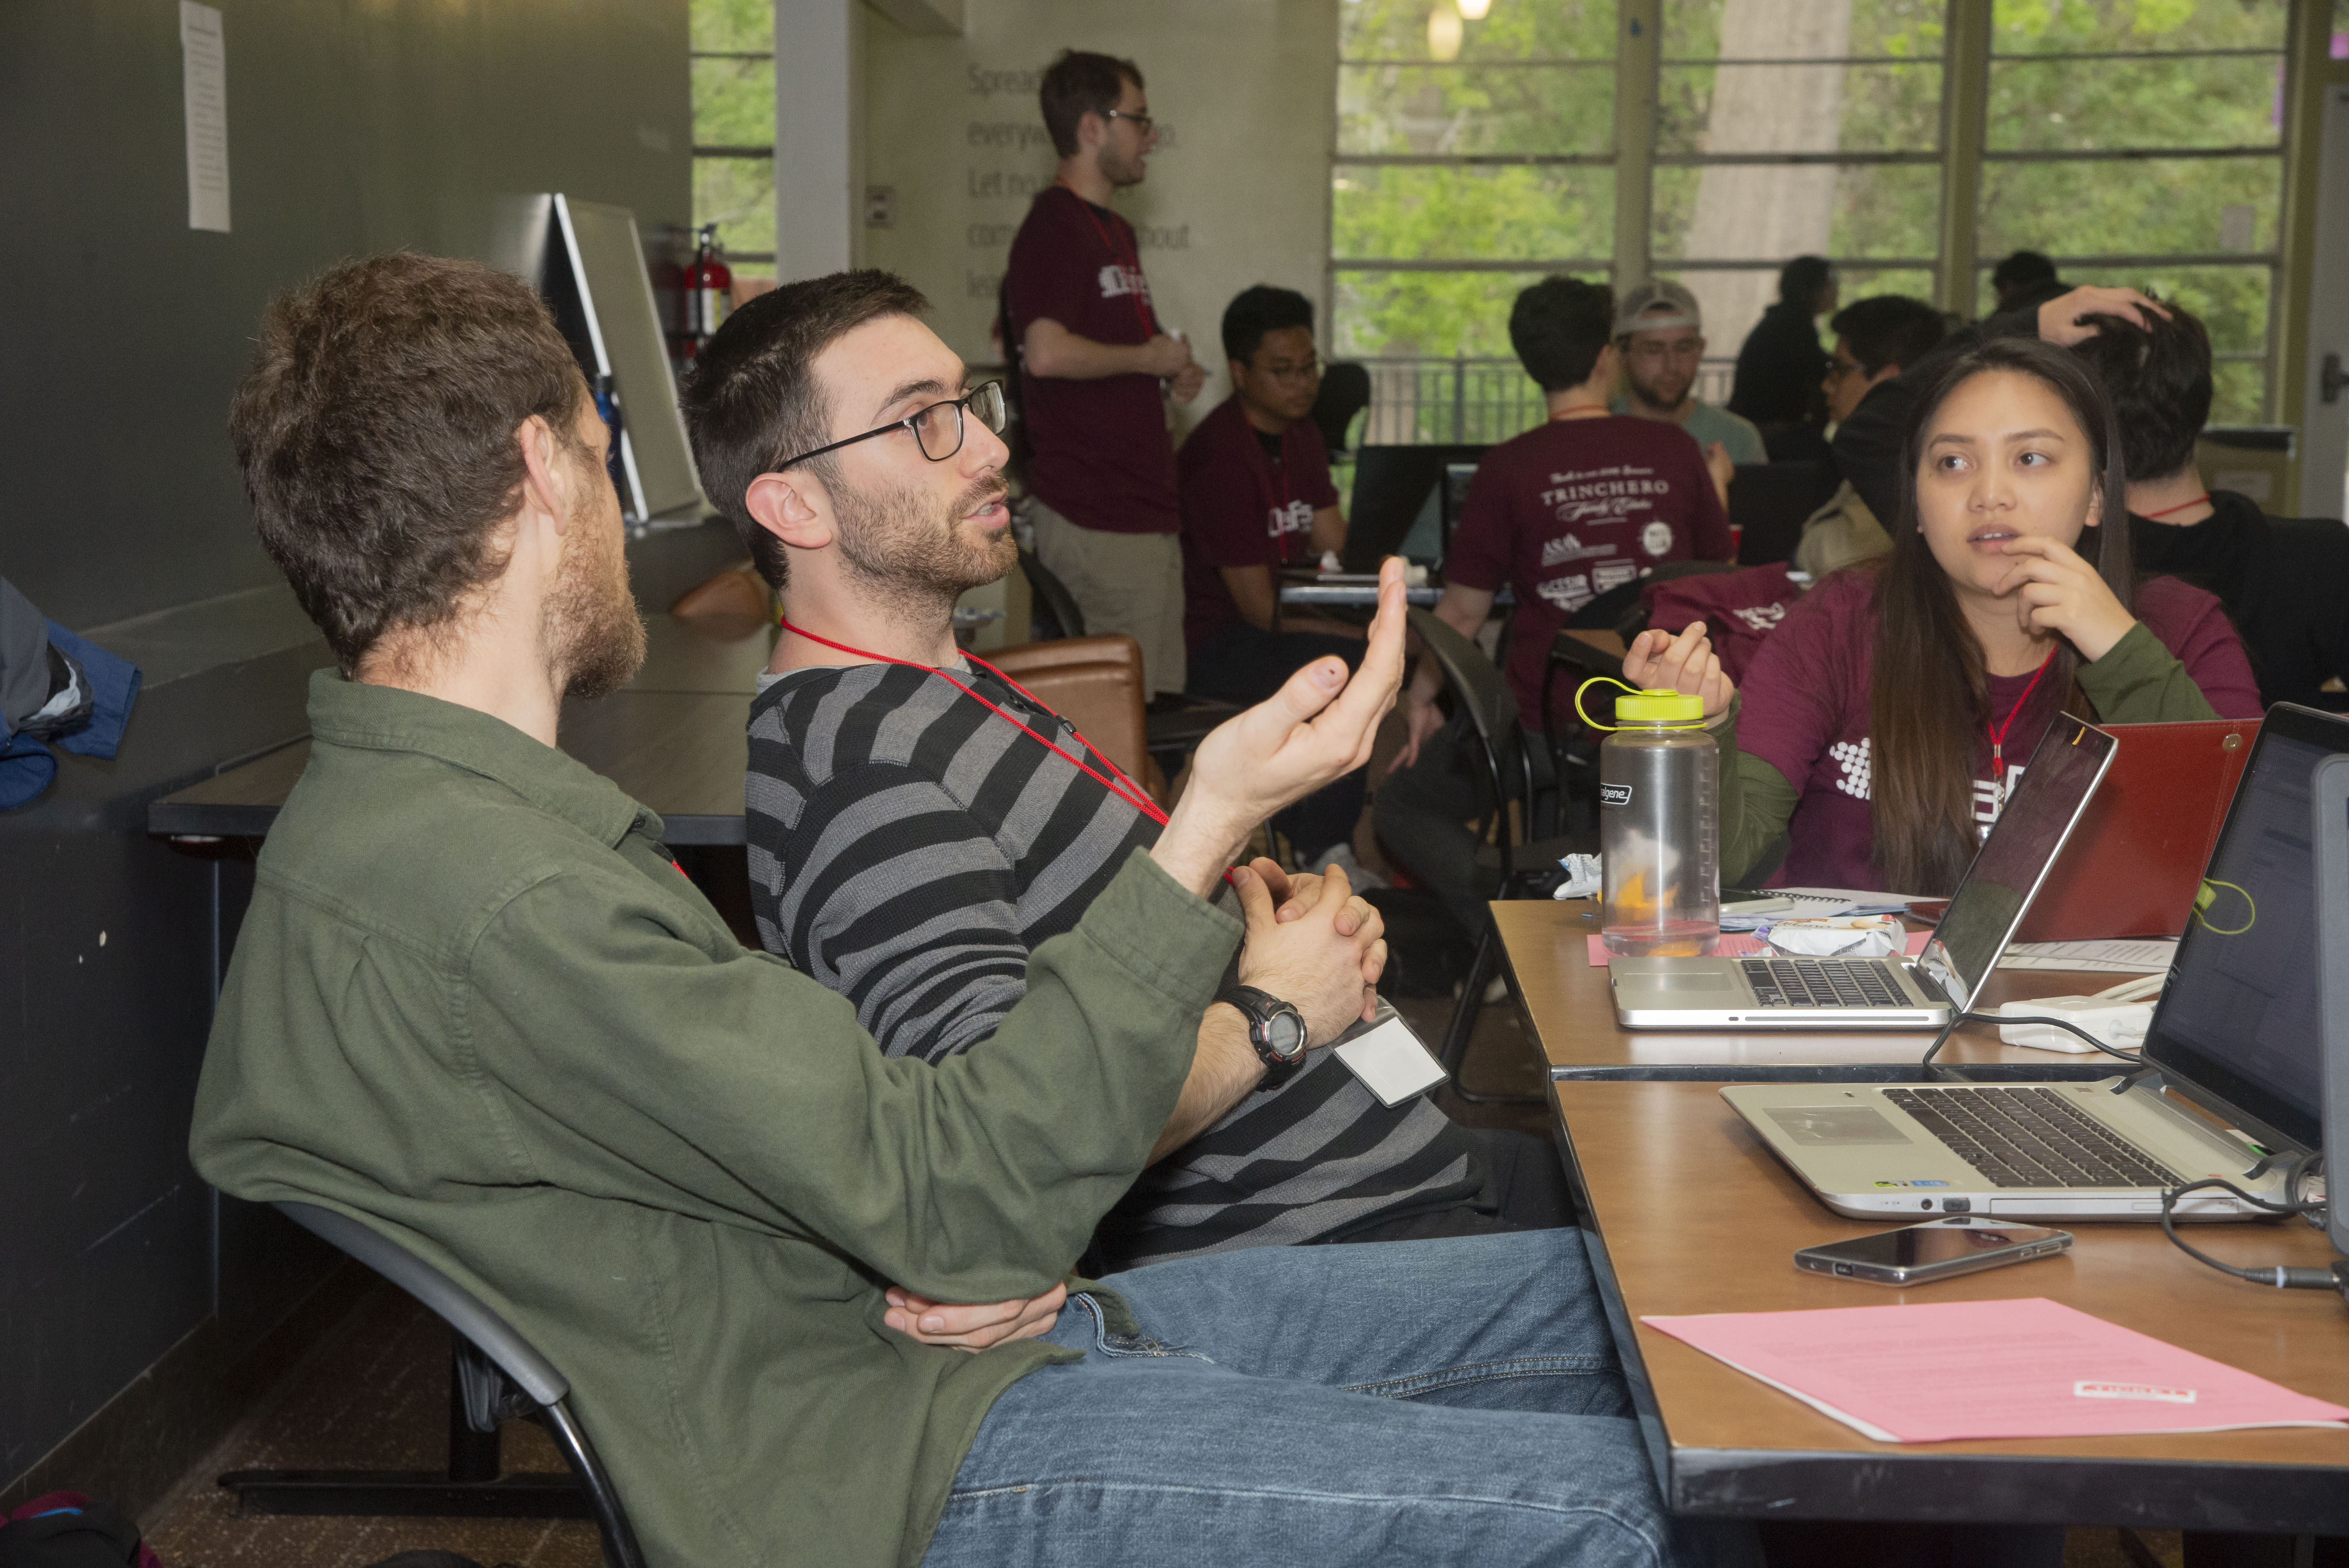
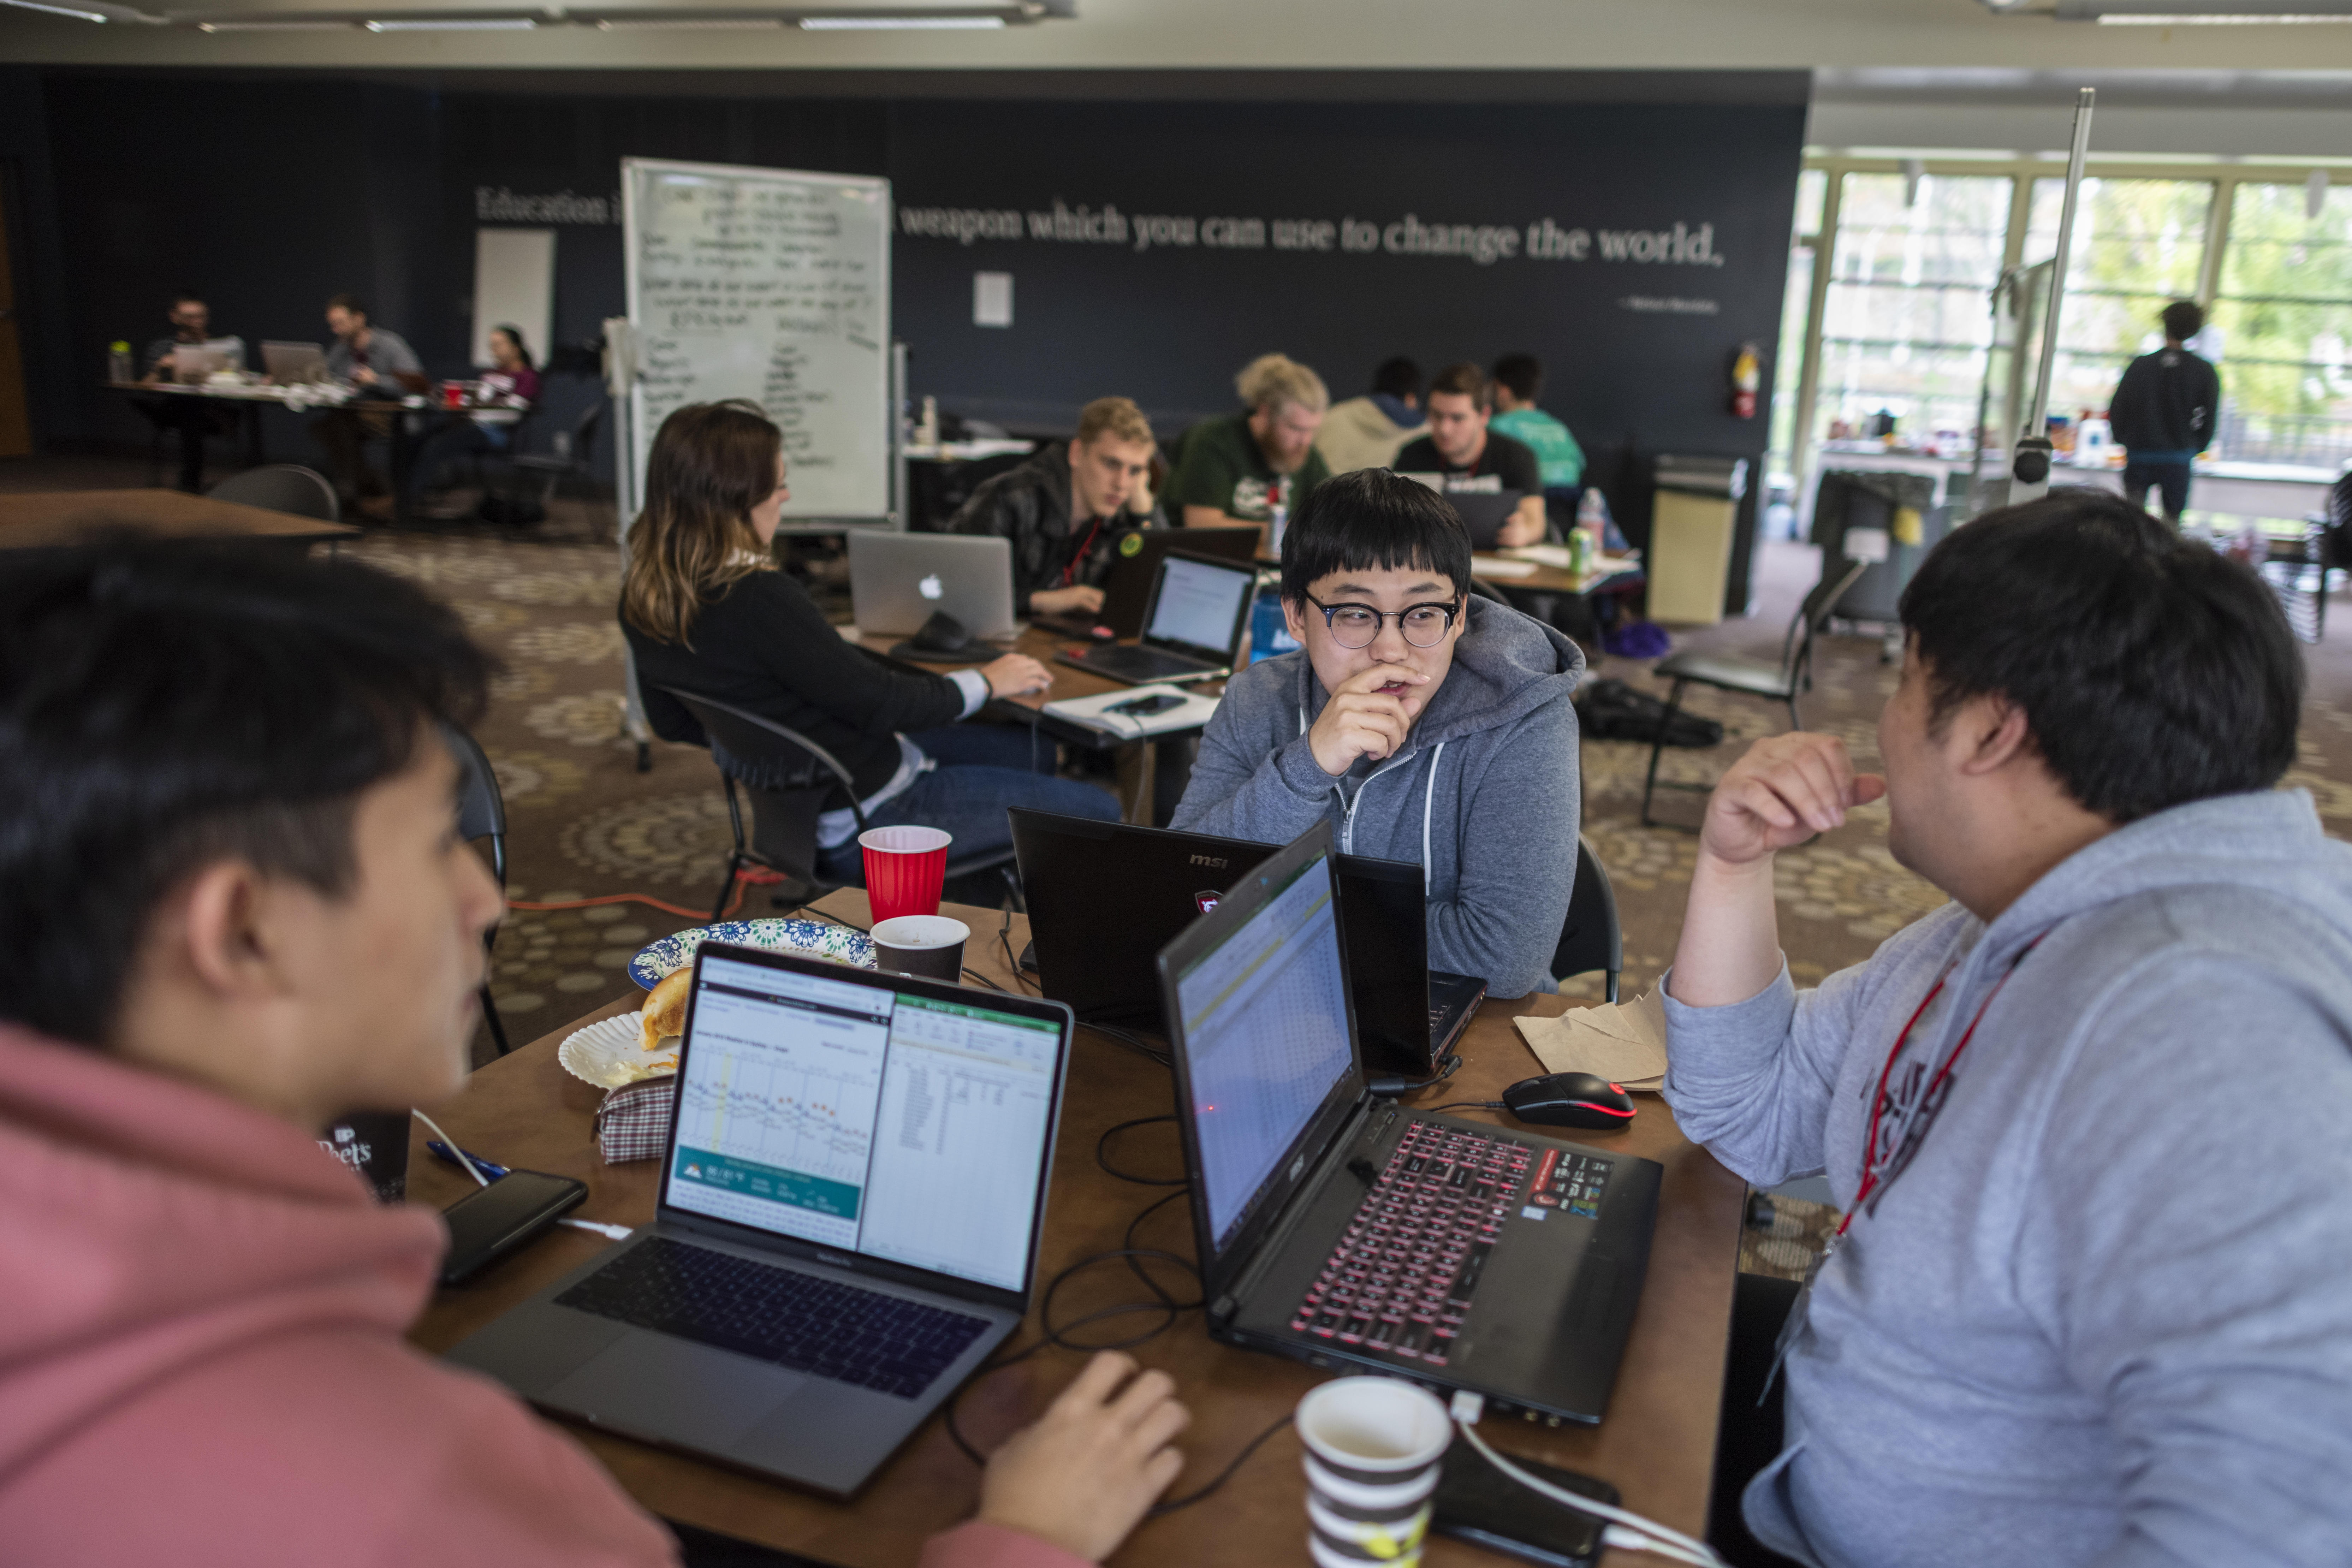
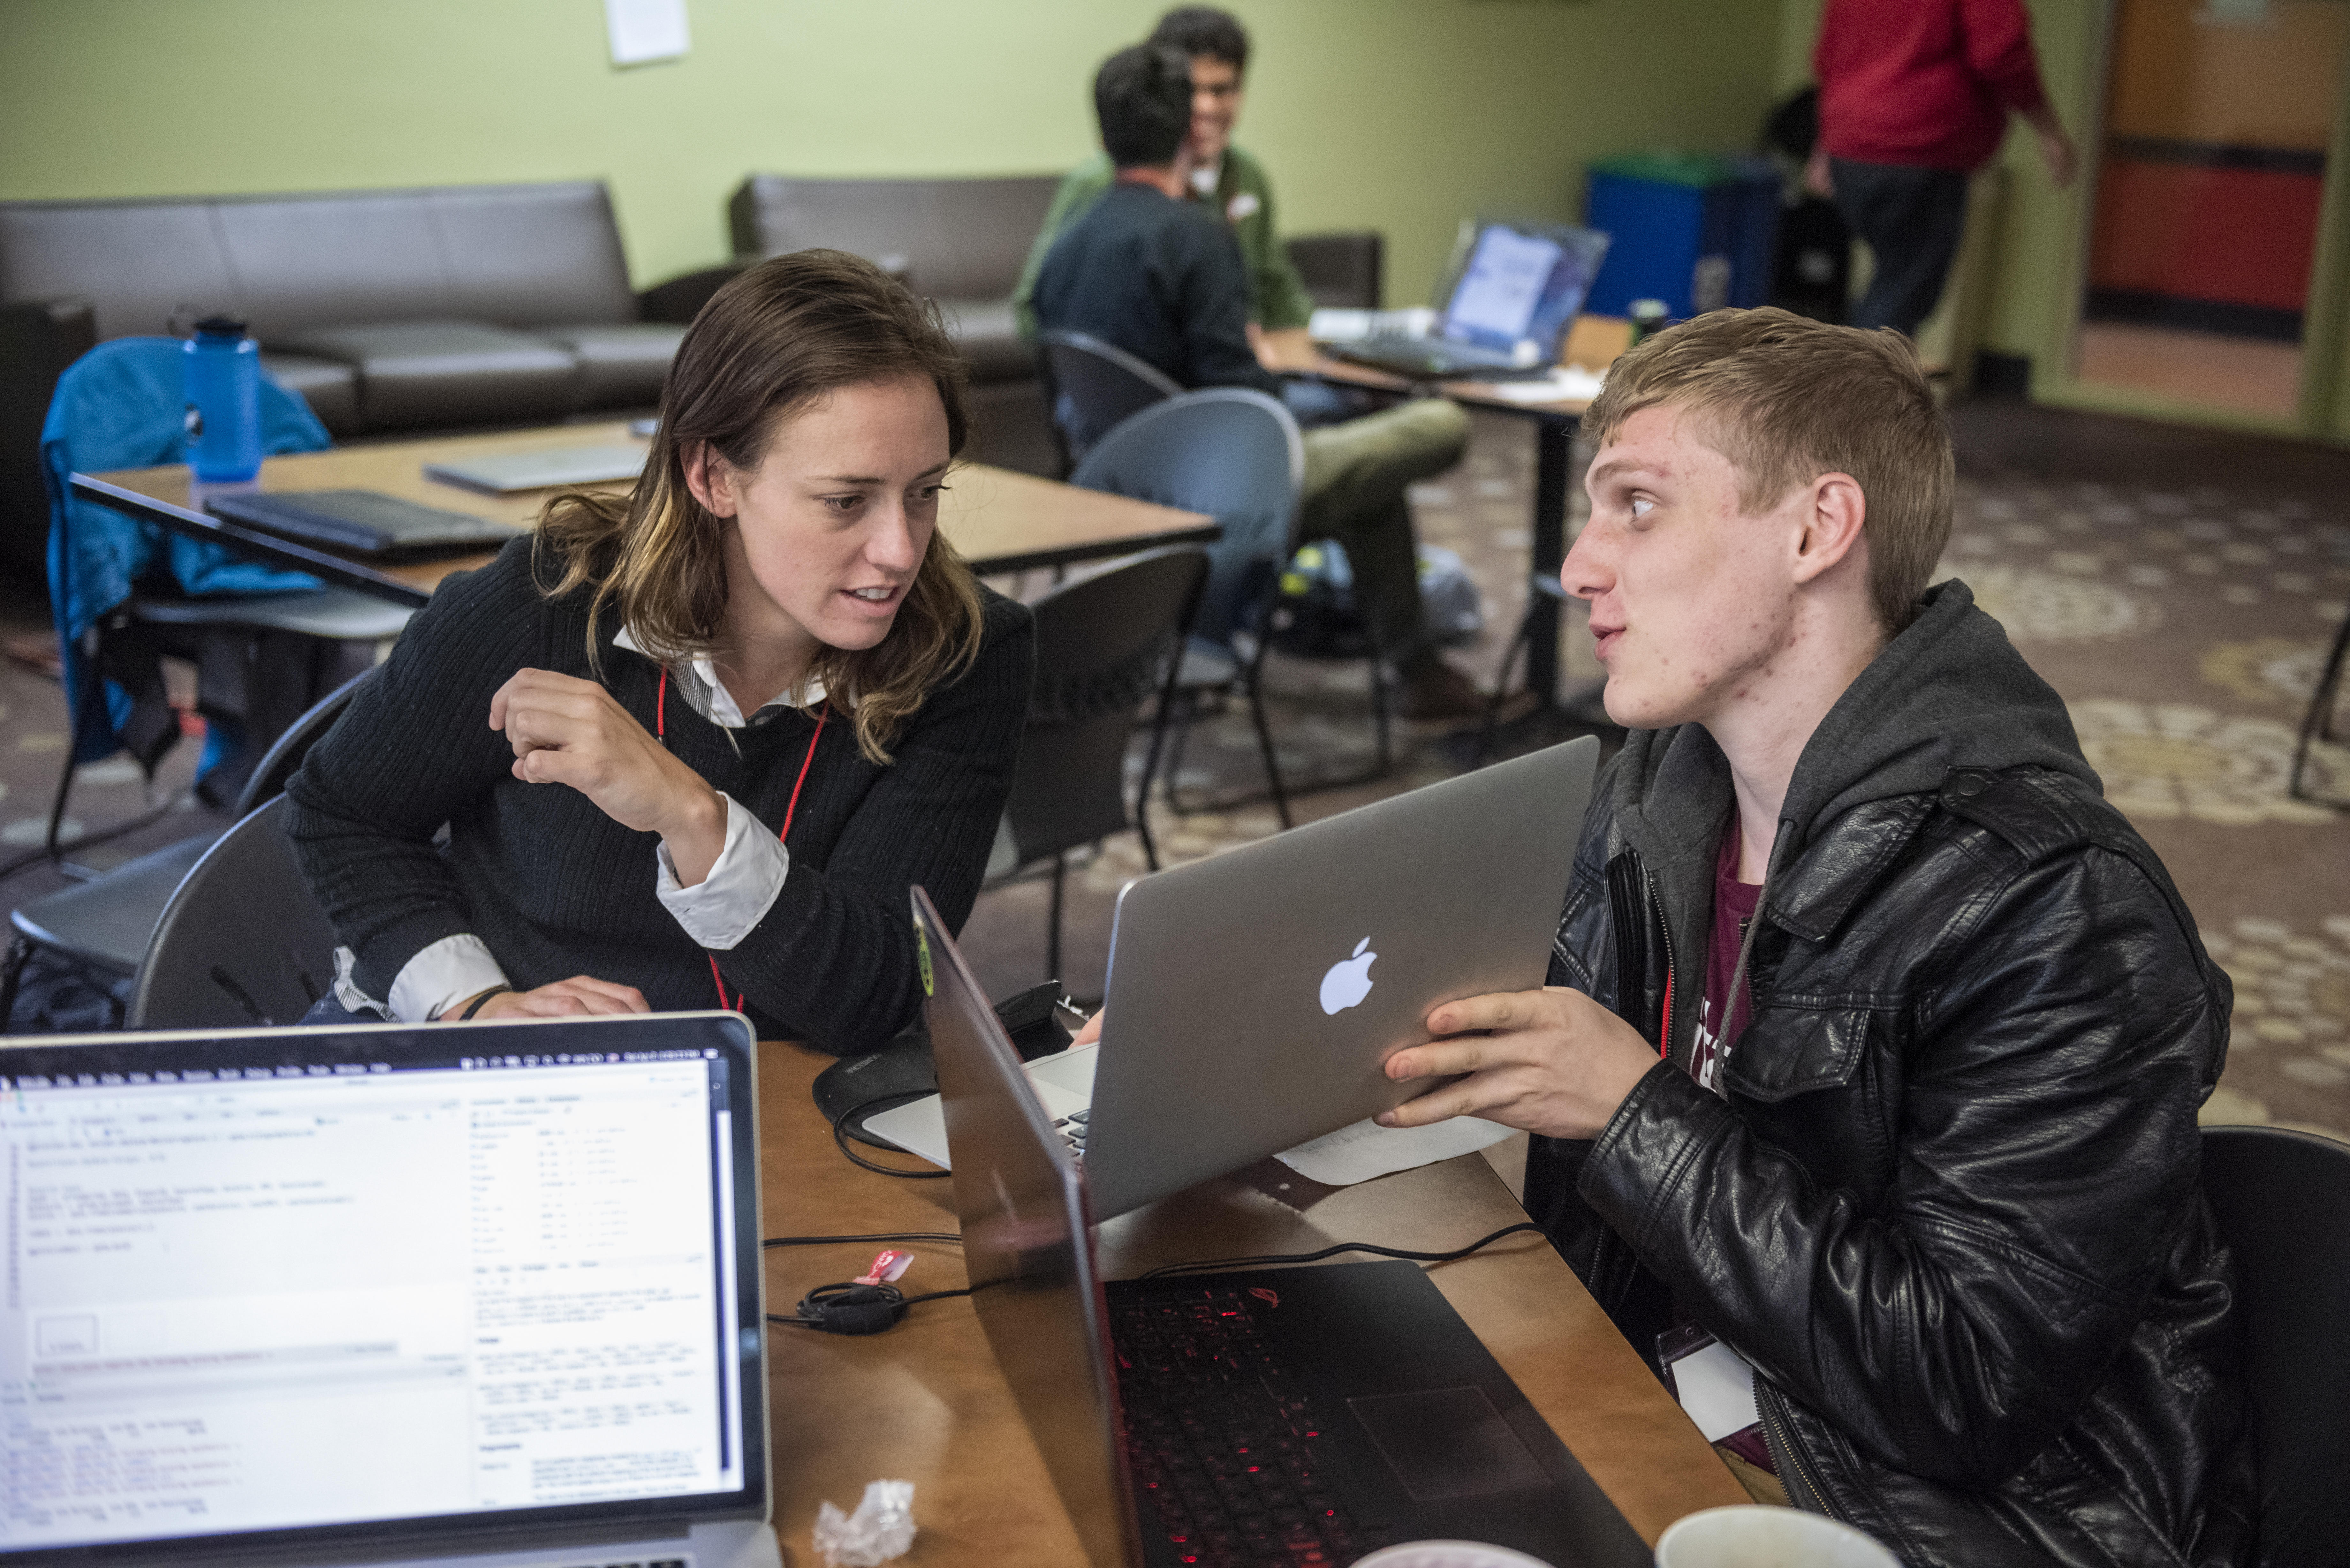
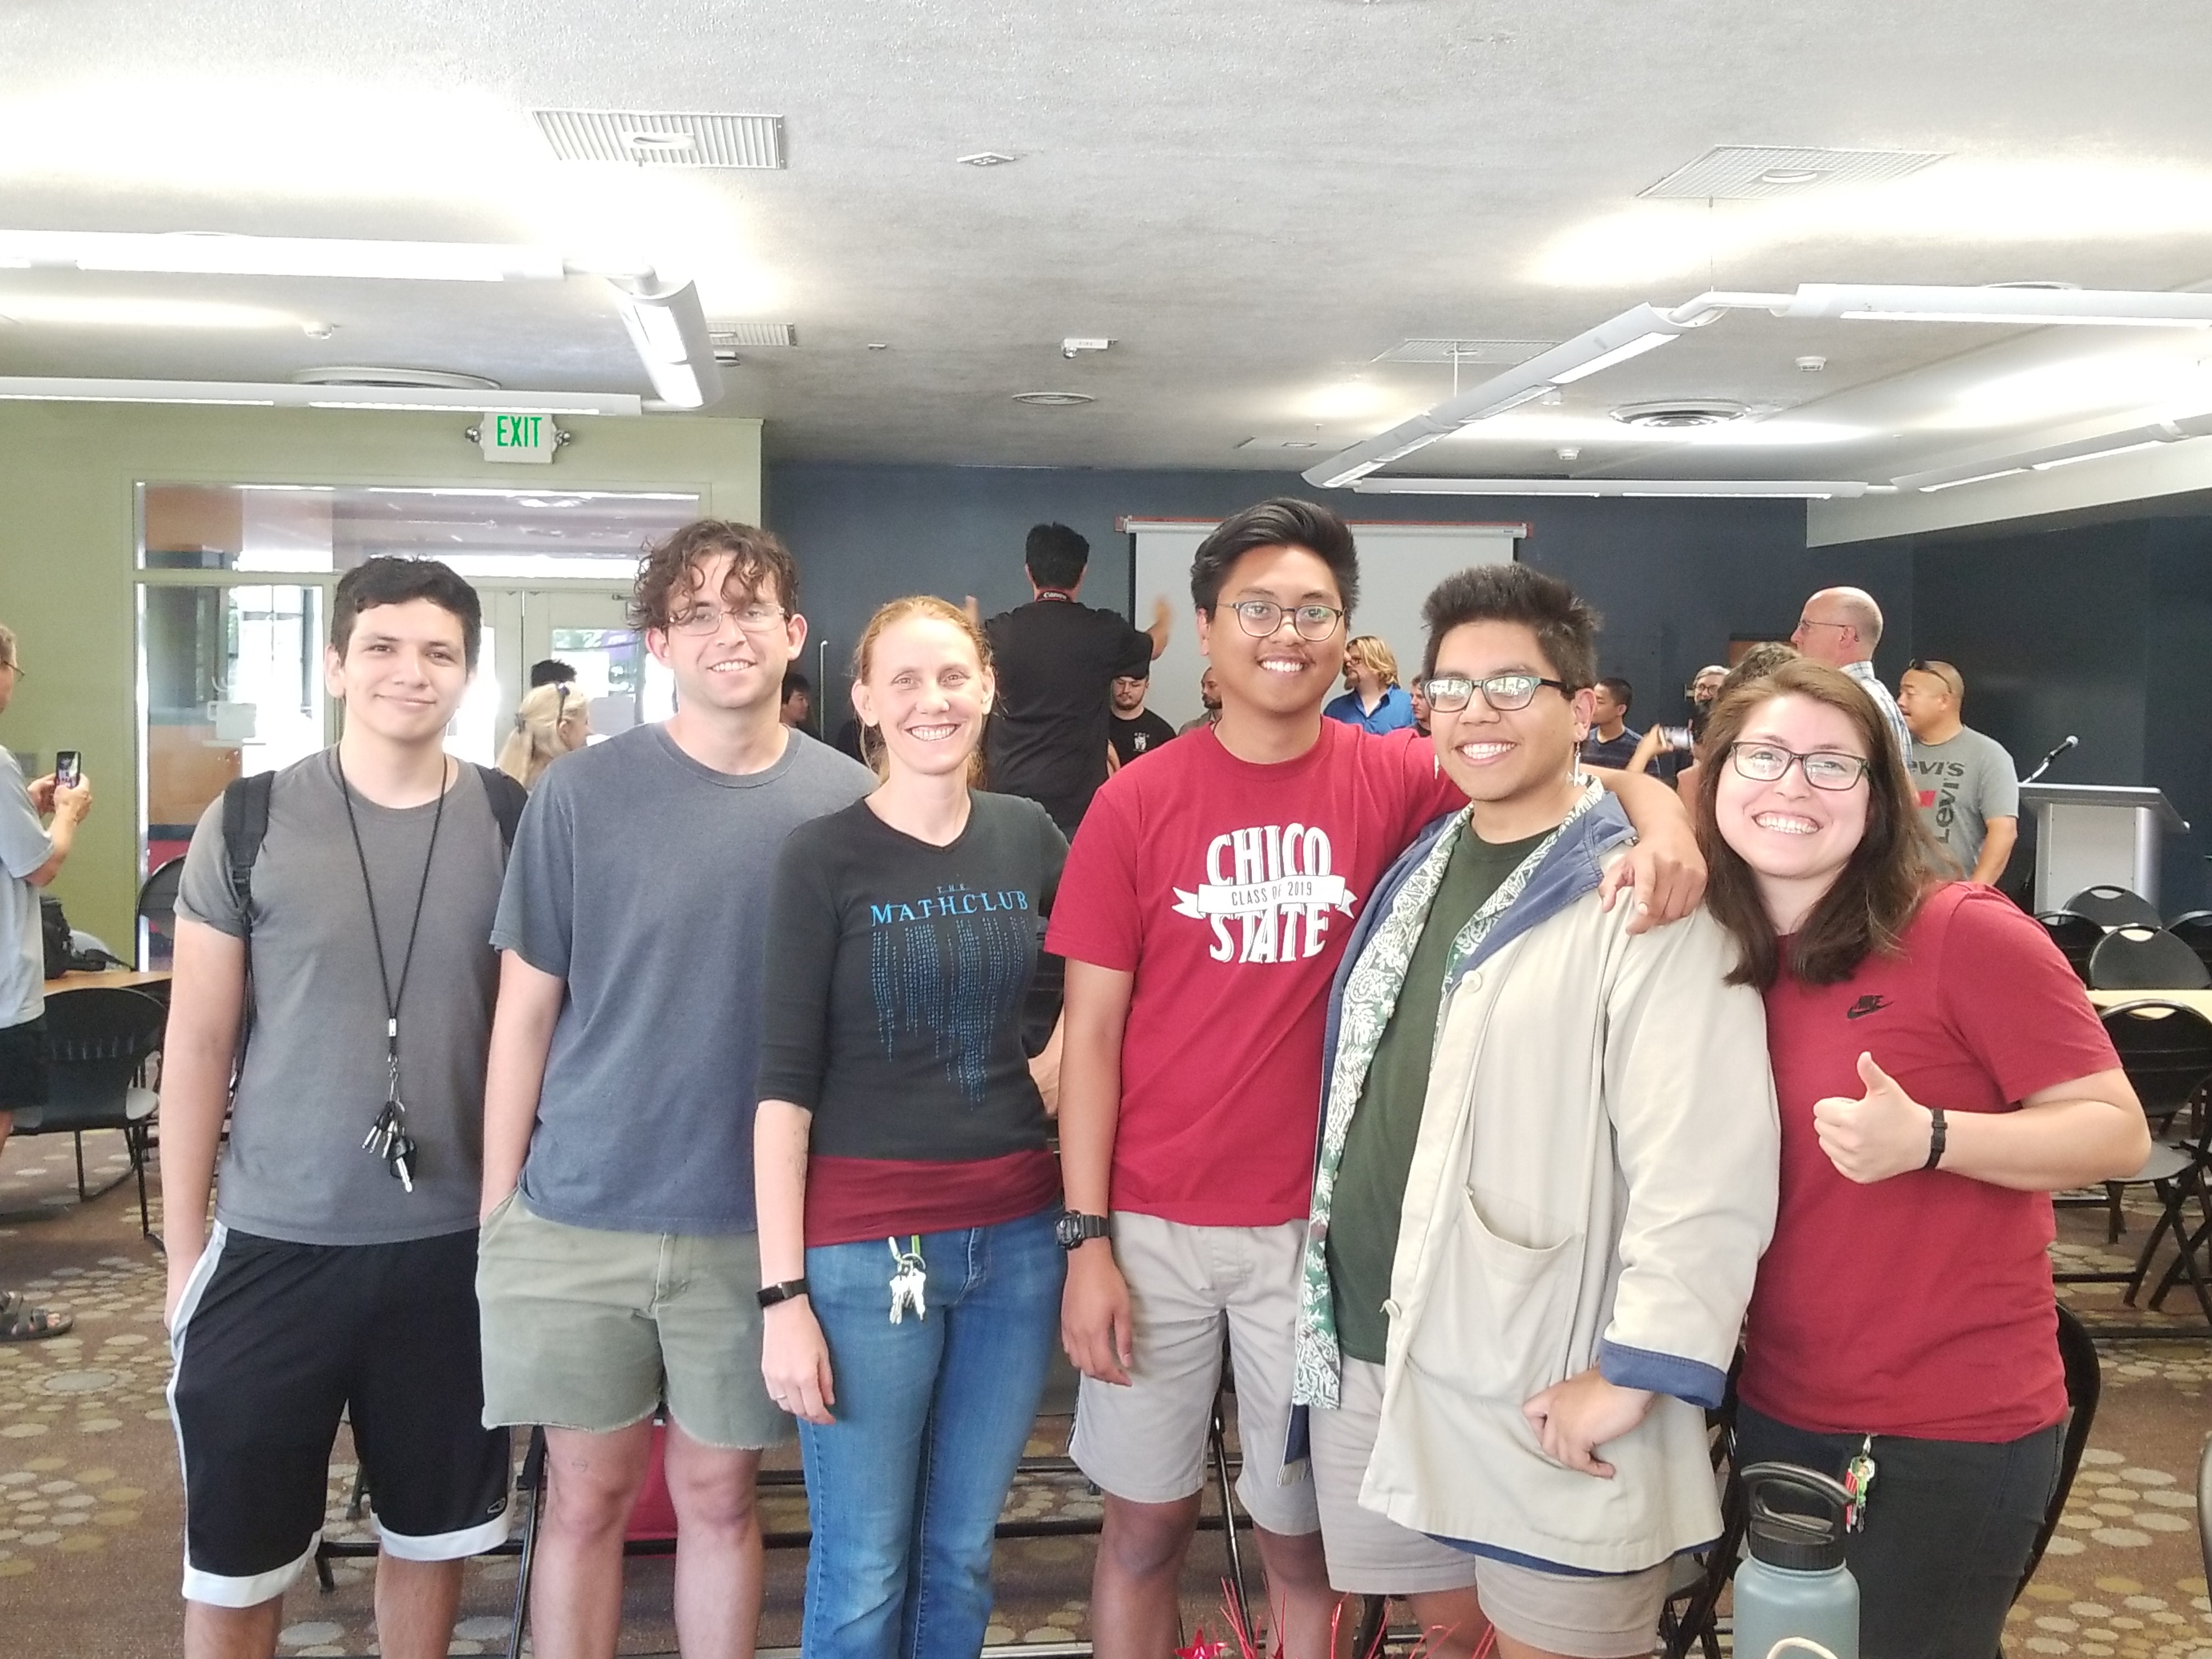
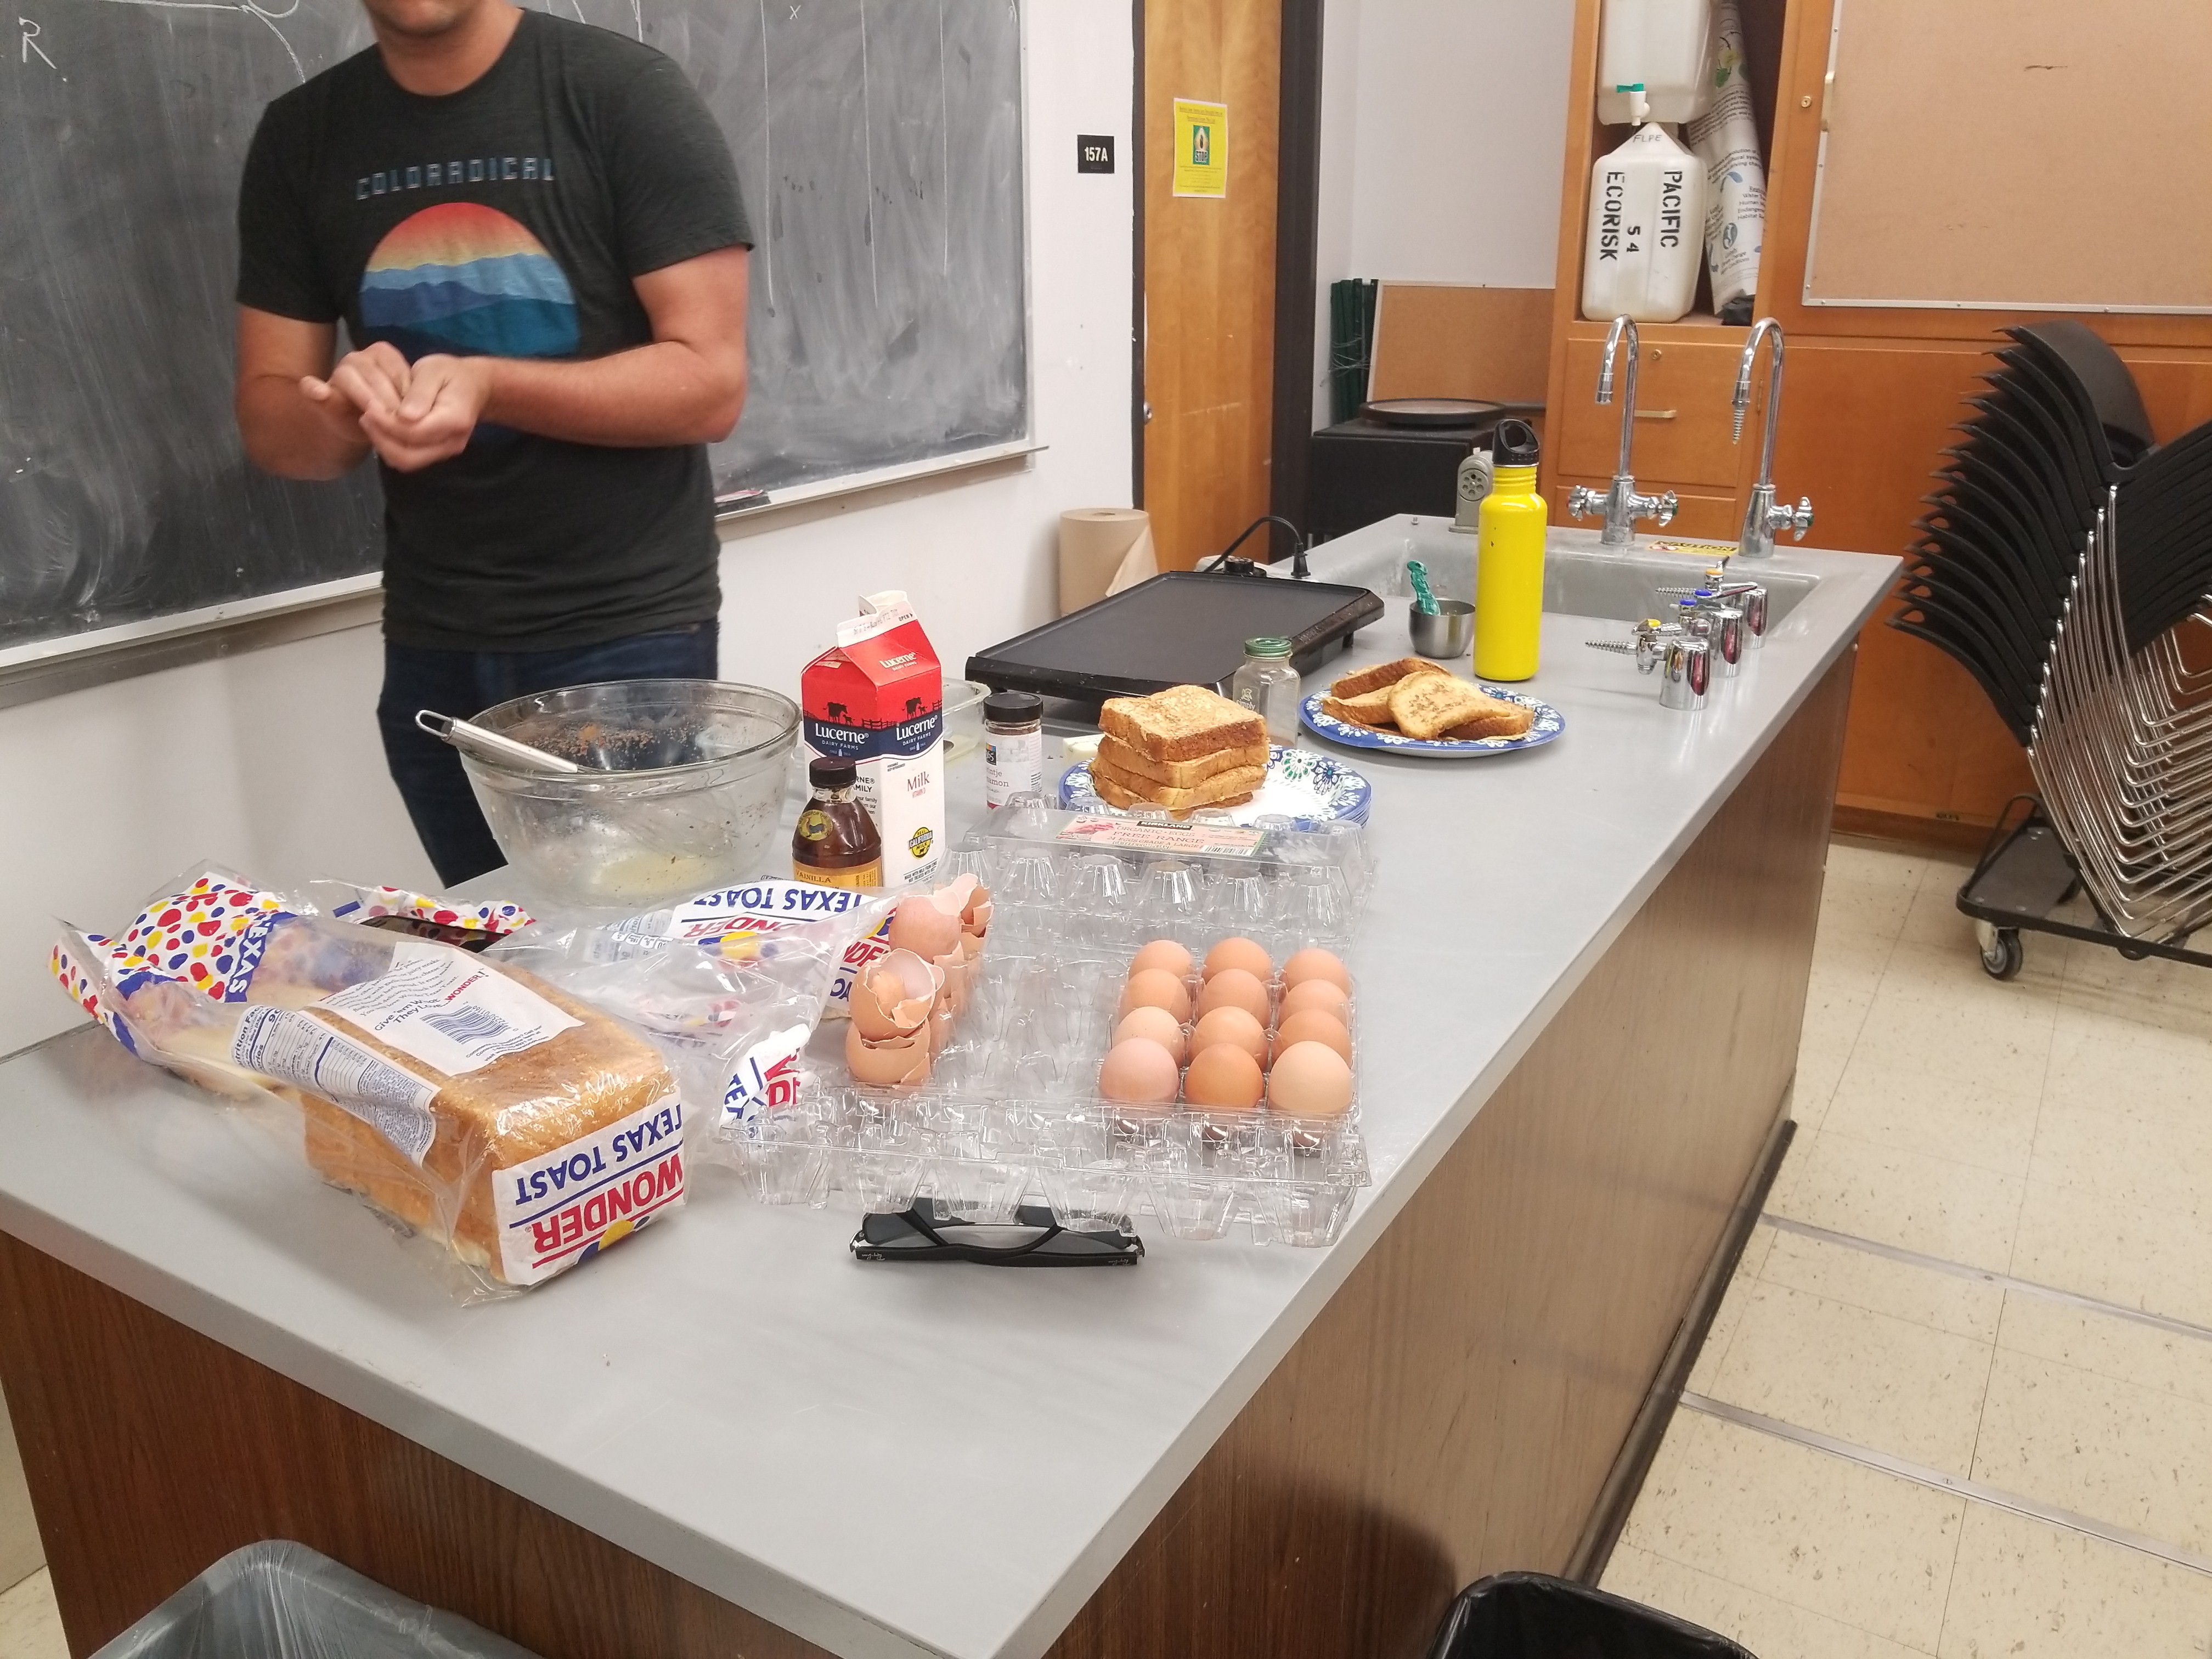
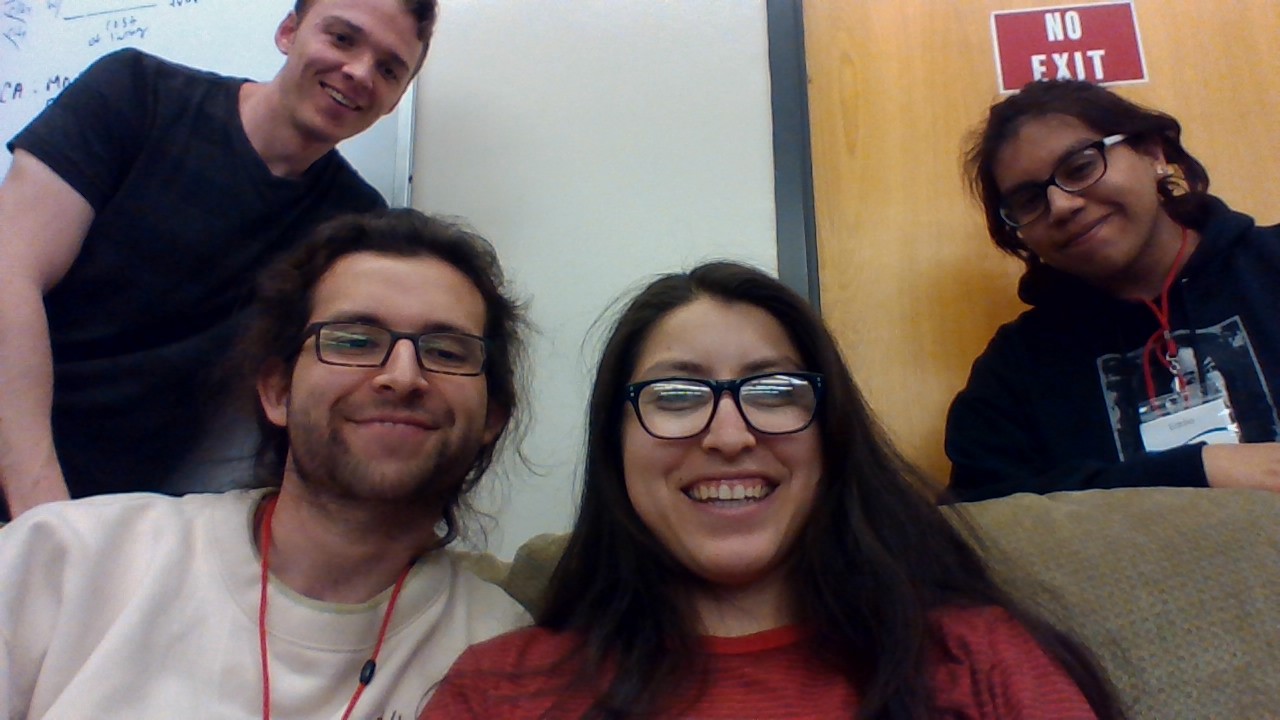
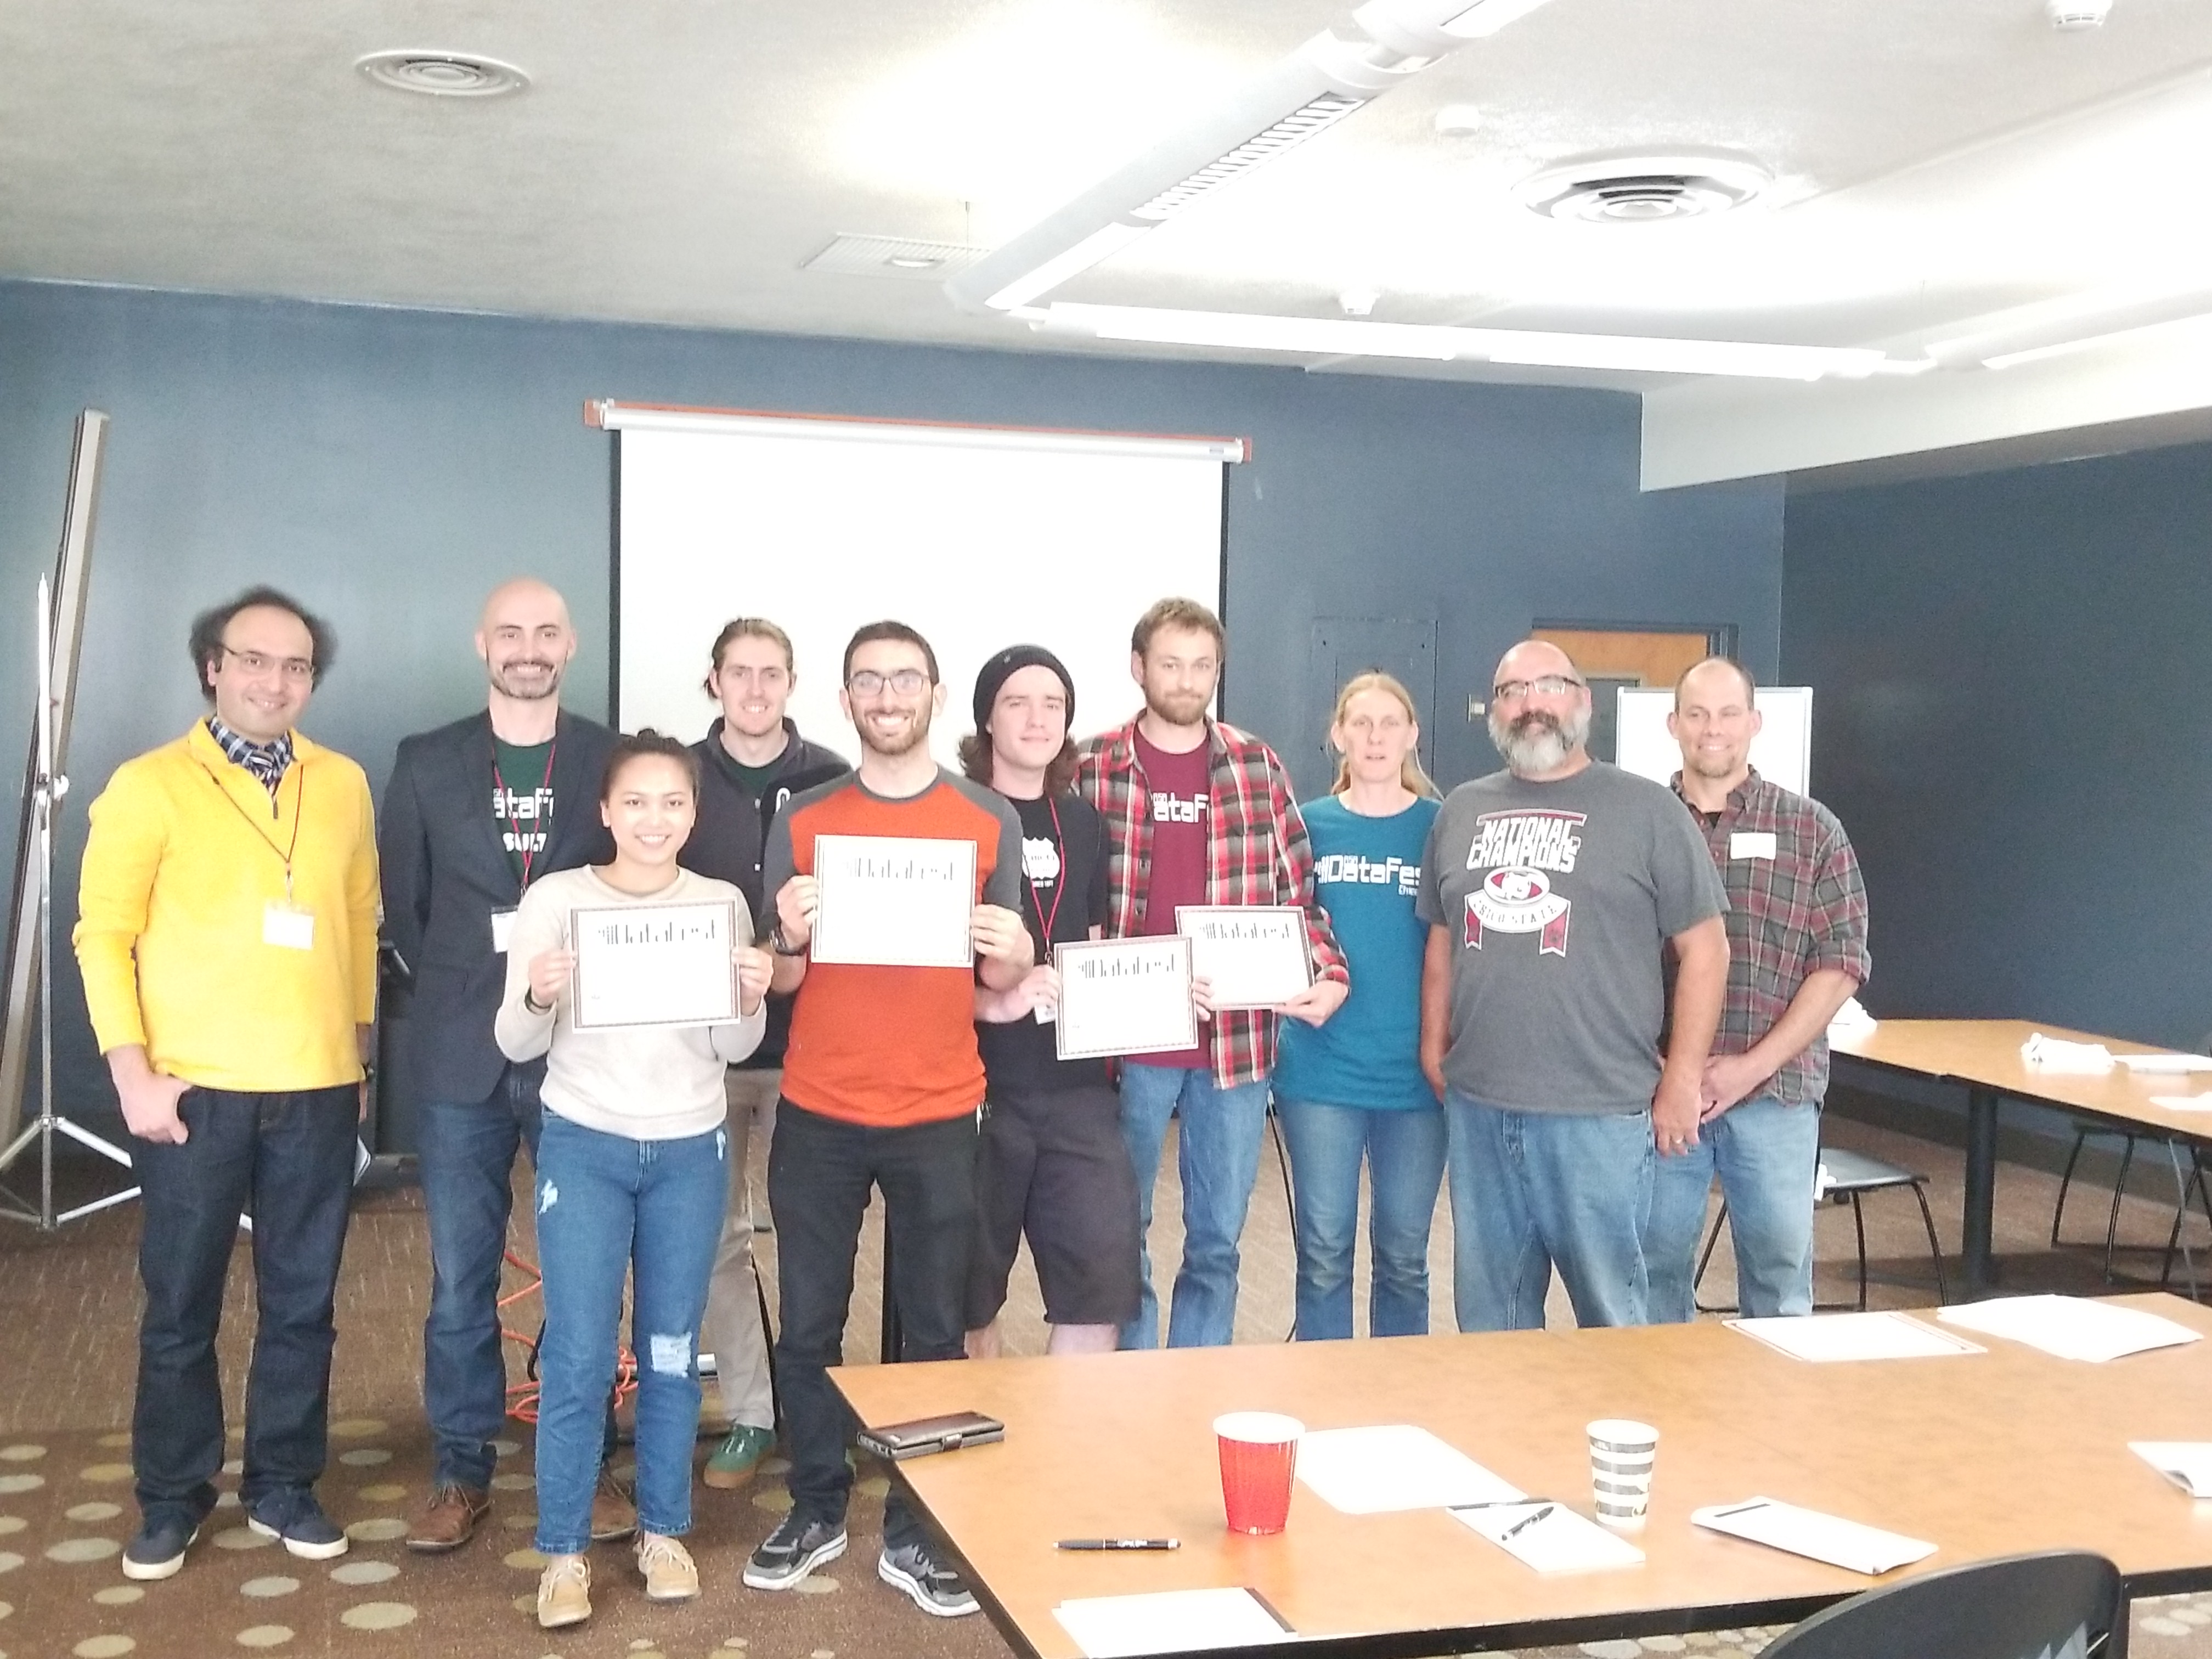
Having fun and hard at work!
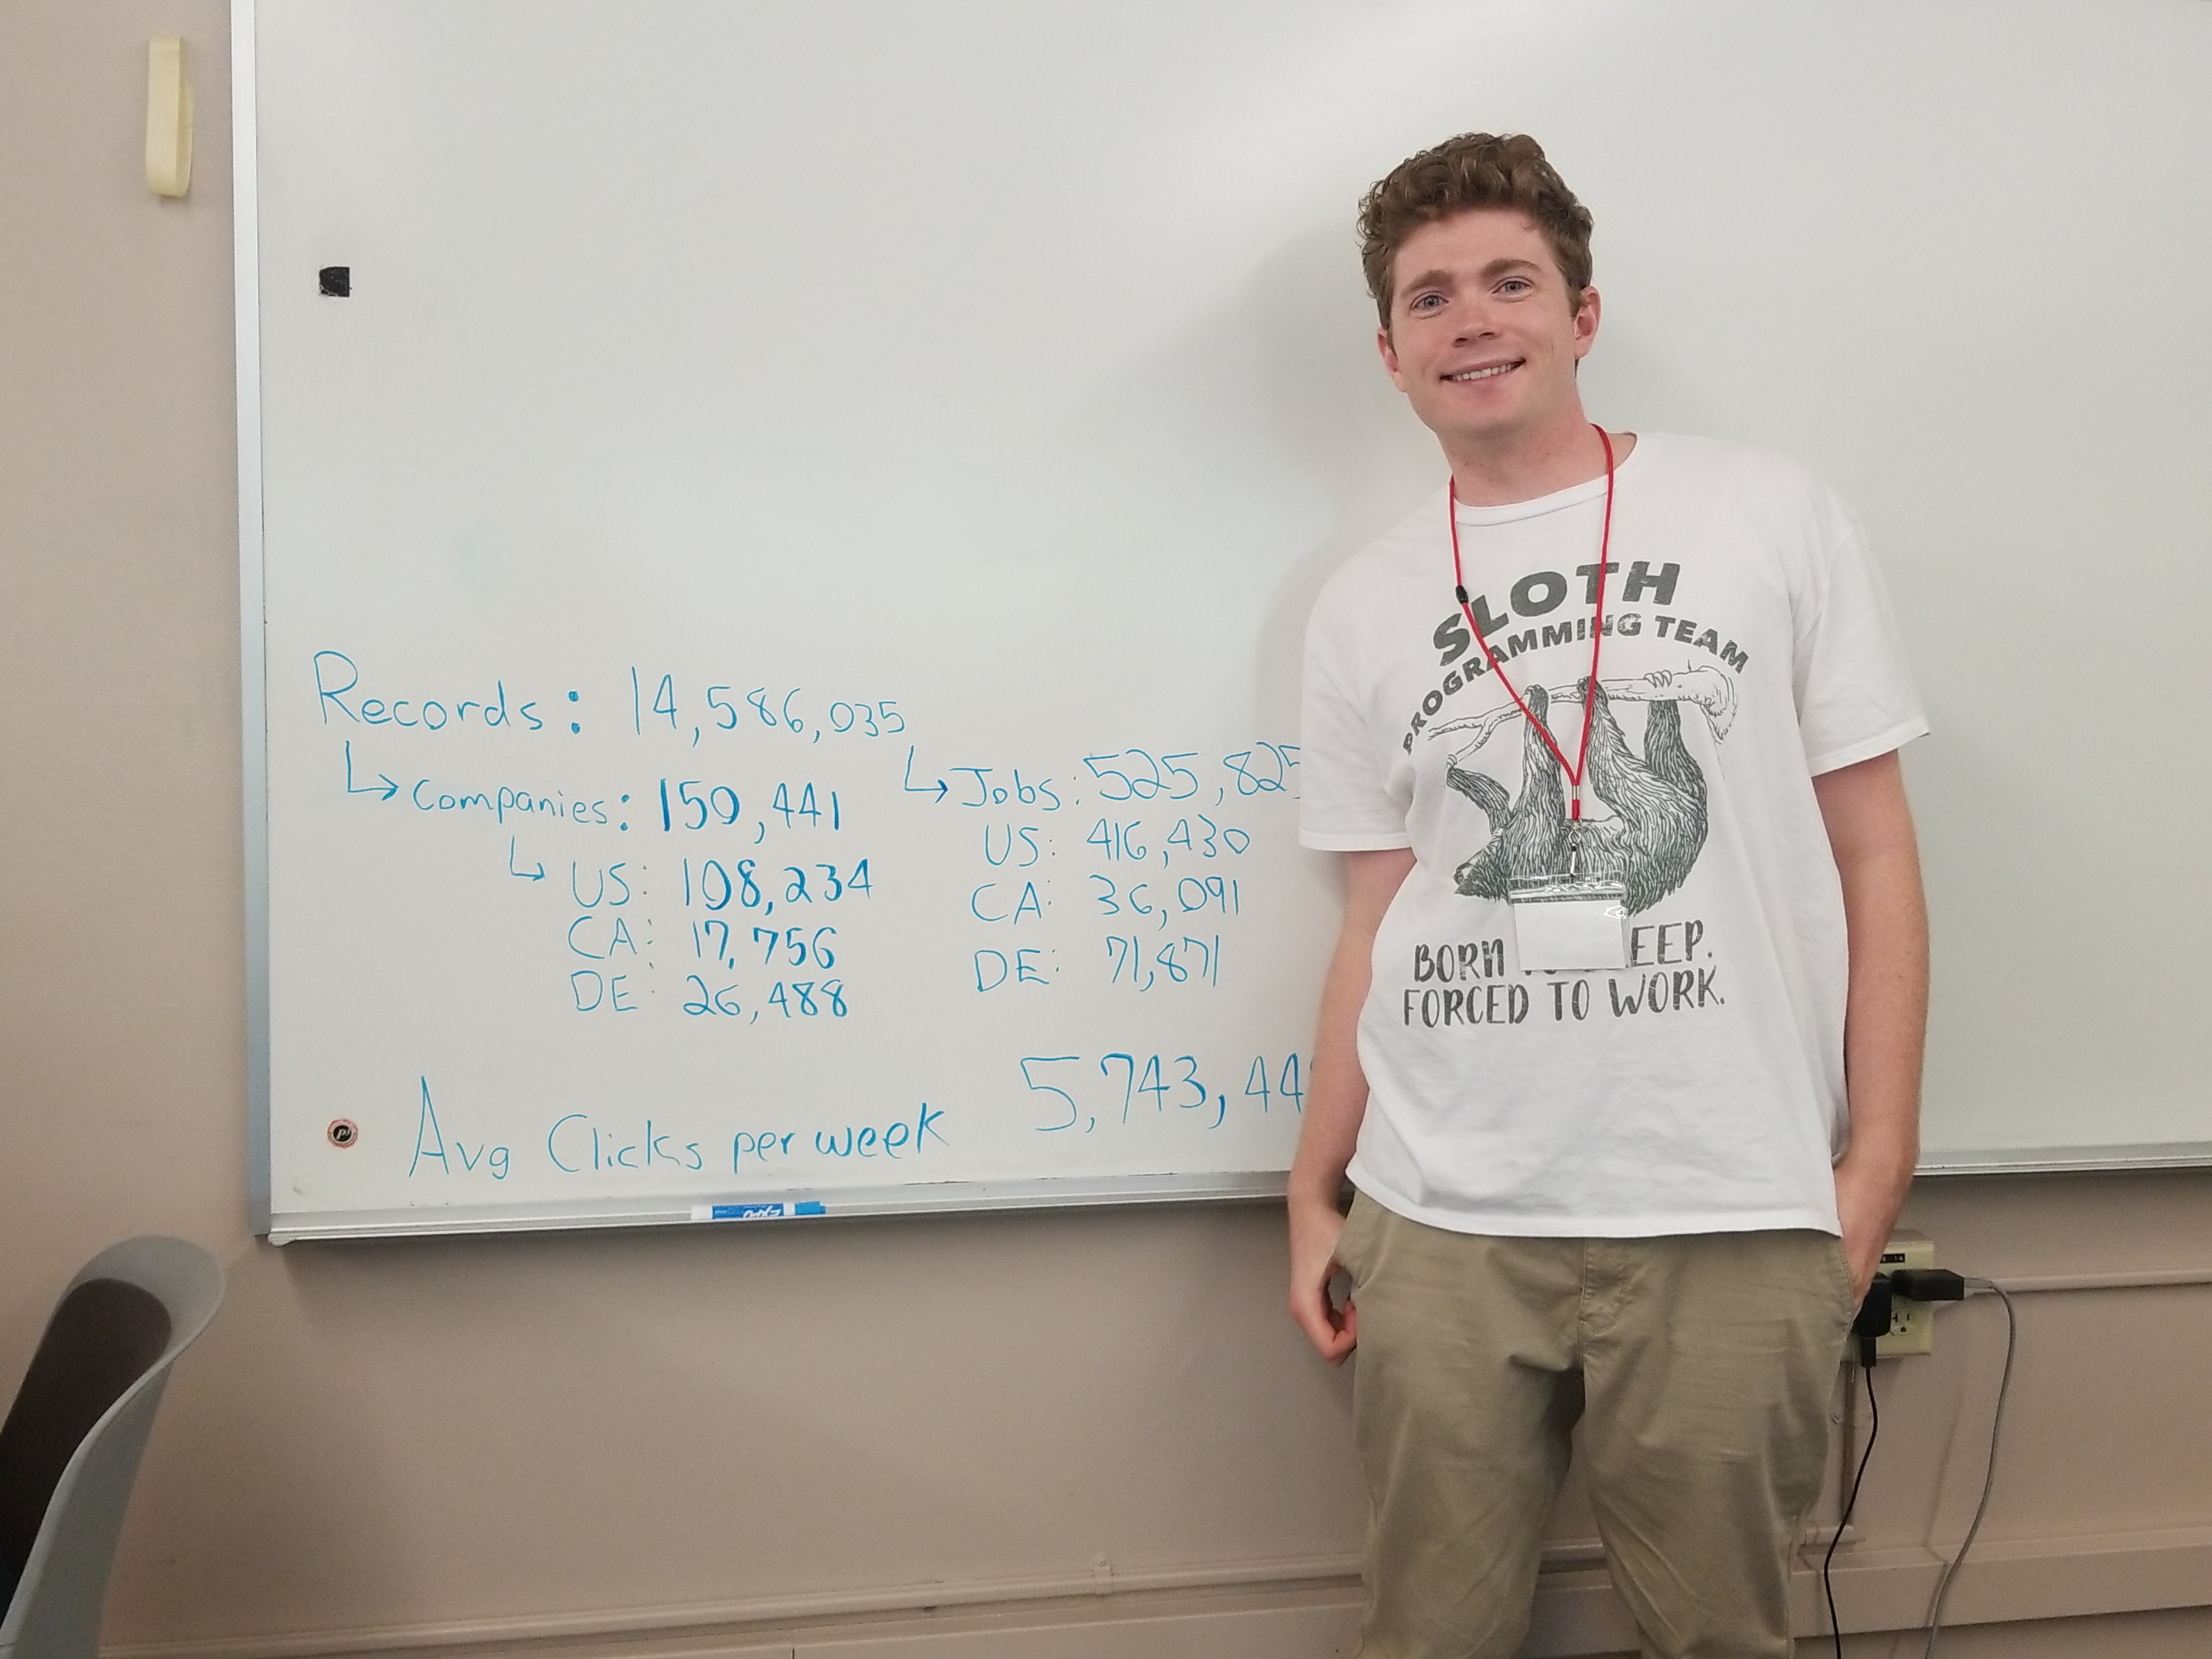
2018 - Indeed.com
Our first year saw 12 undergraduate students from Applied Mathematics, Statistics, but also Computer Science, Construction Management, Civil Engineering, and Biology. The diversity of backgrounds and experiences was amazing. Many students were buzzing afterwards about how much fun they had and how much they learned that weekend.
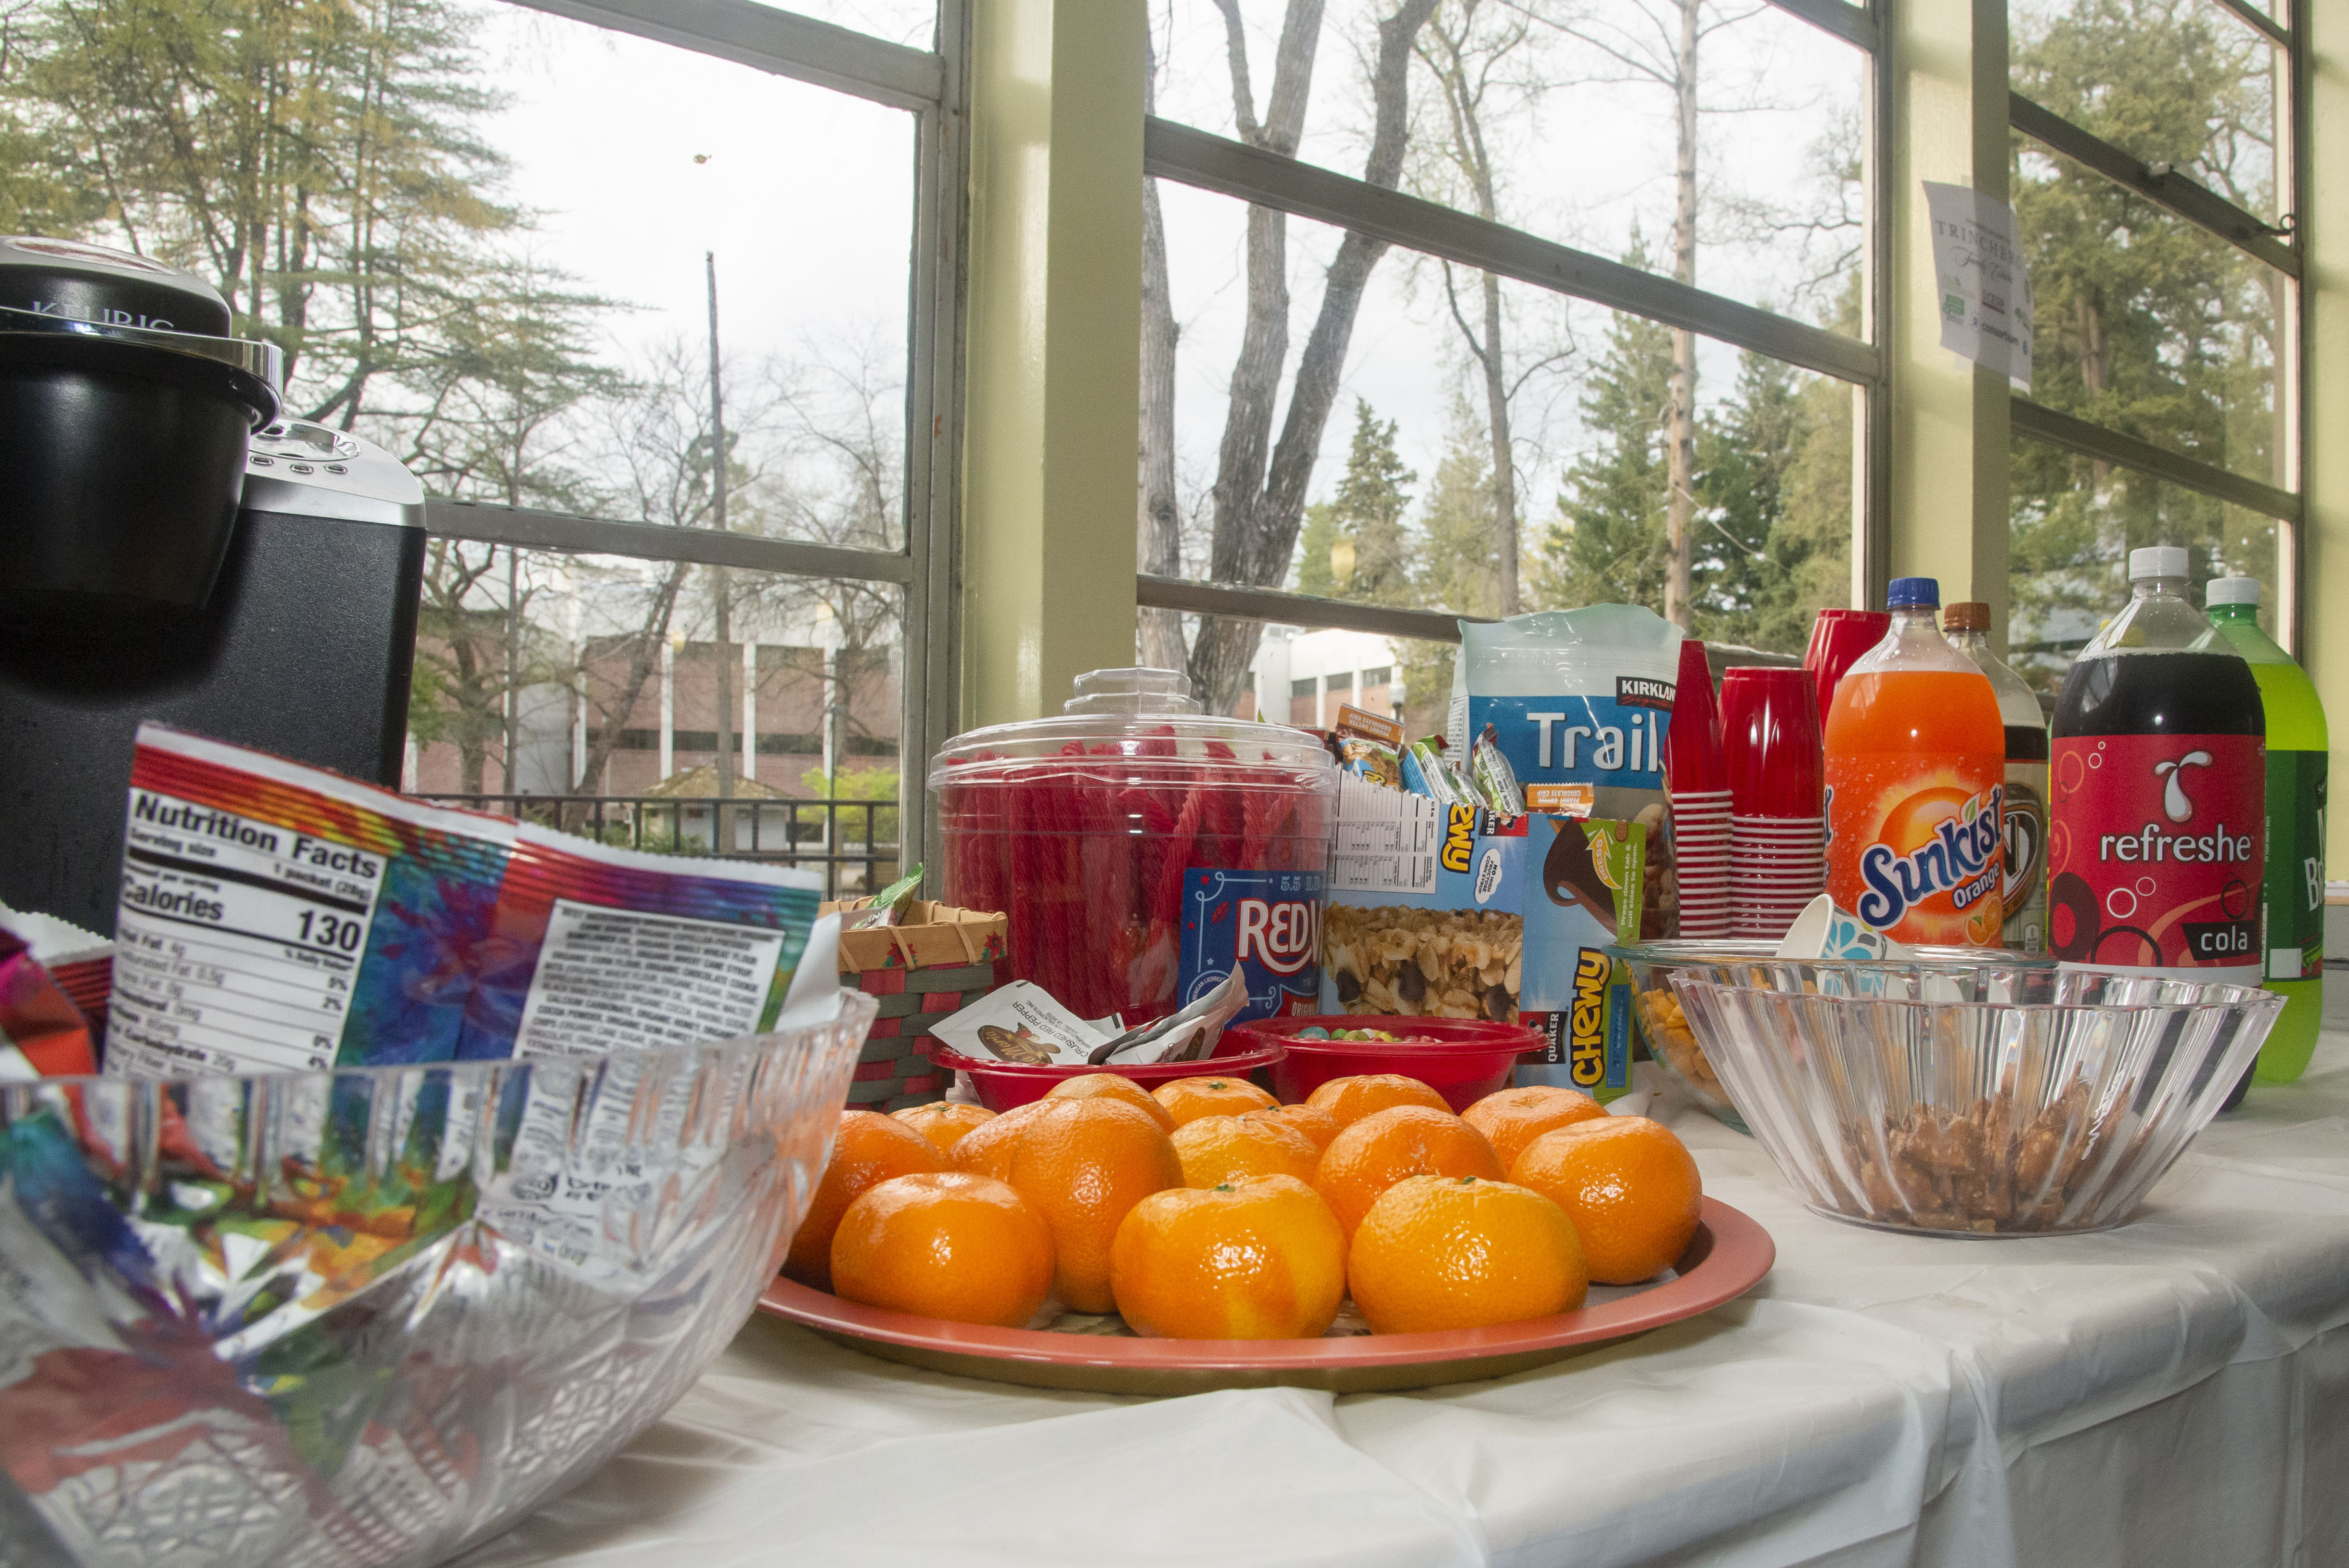
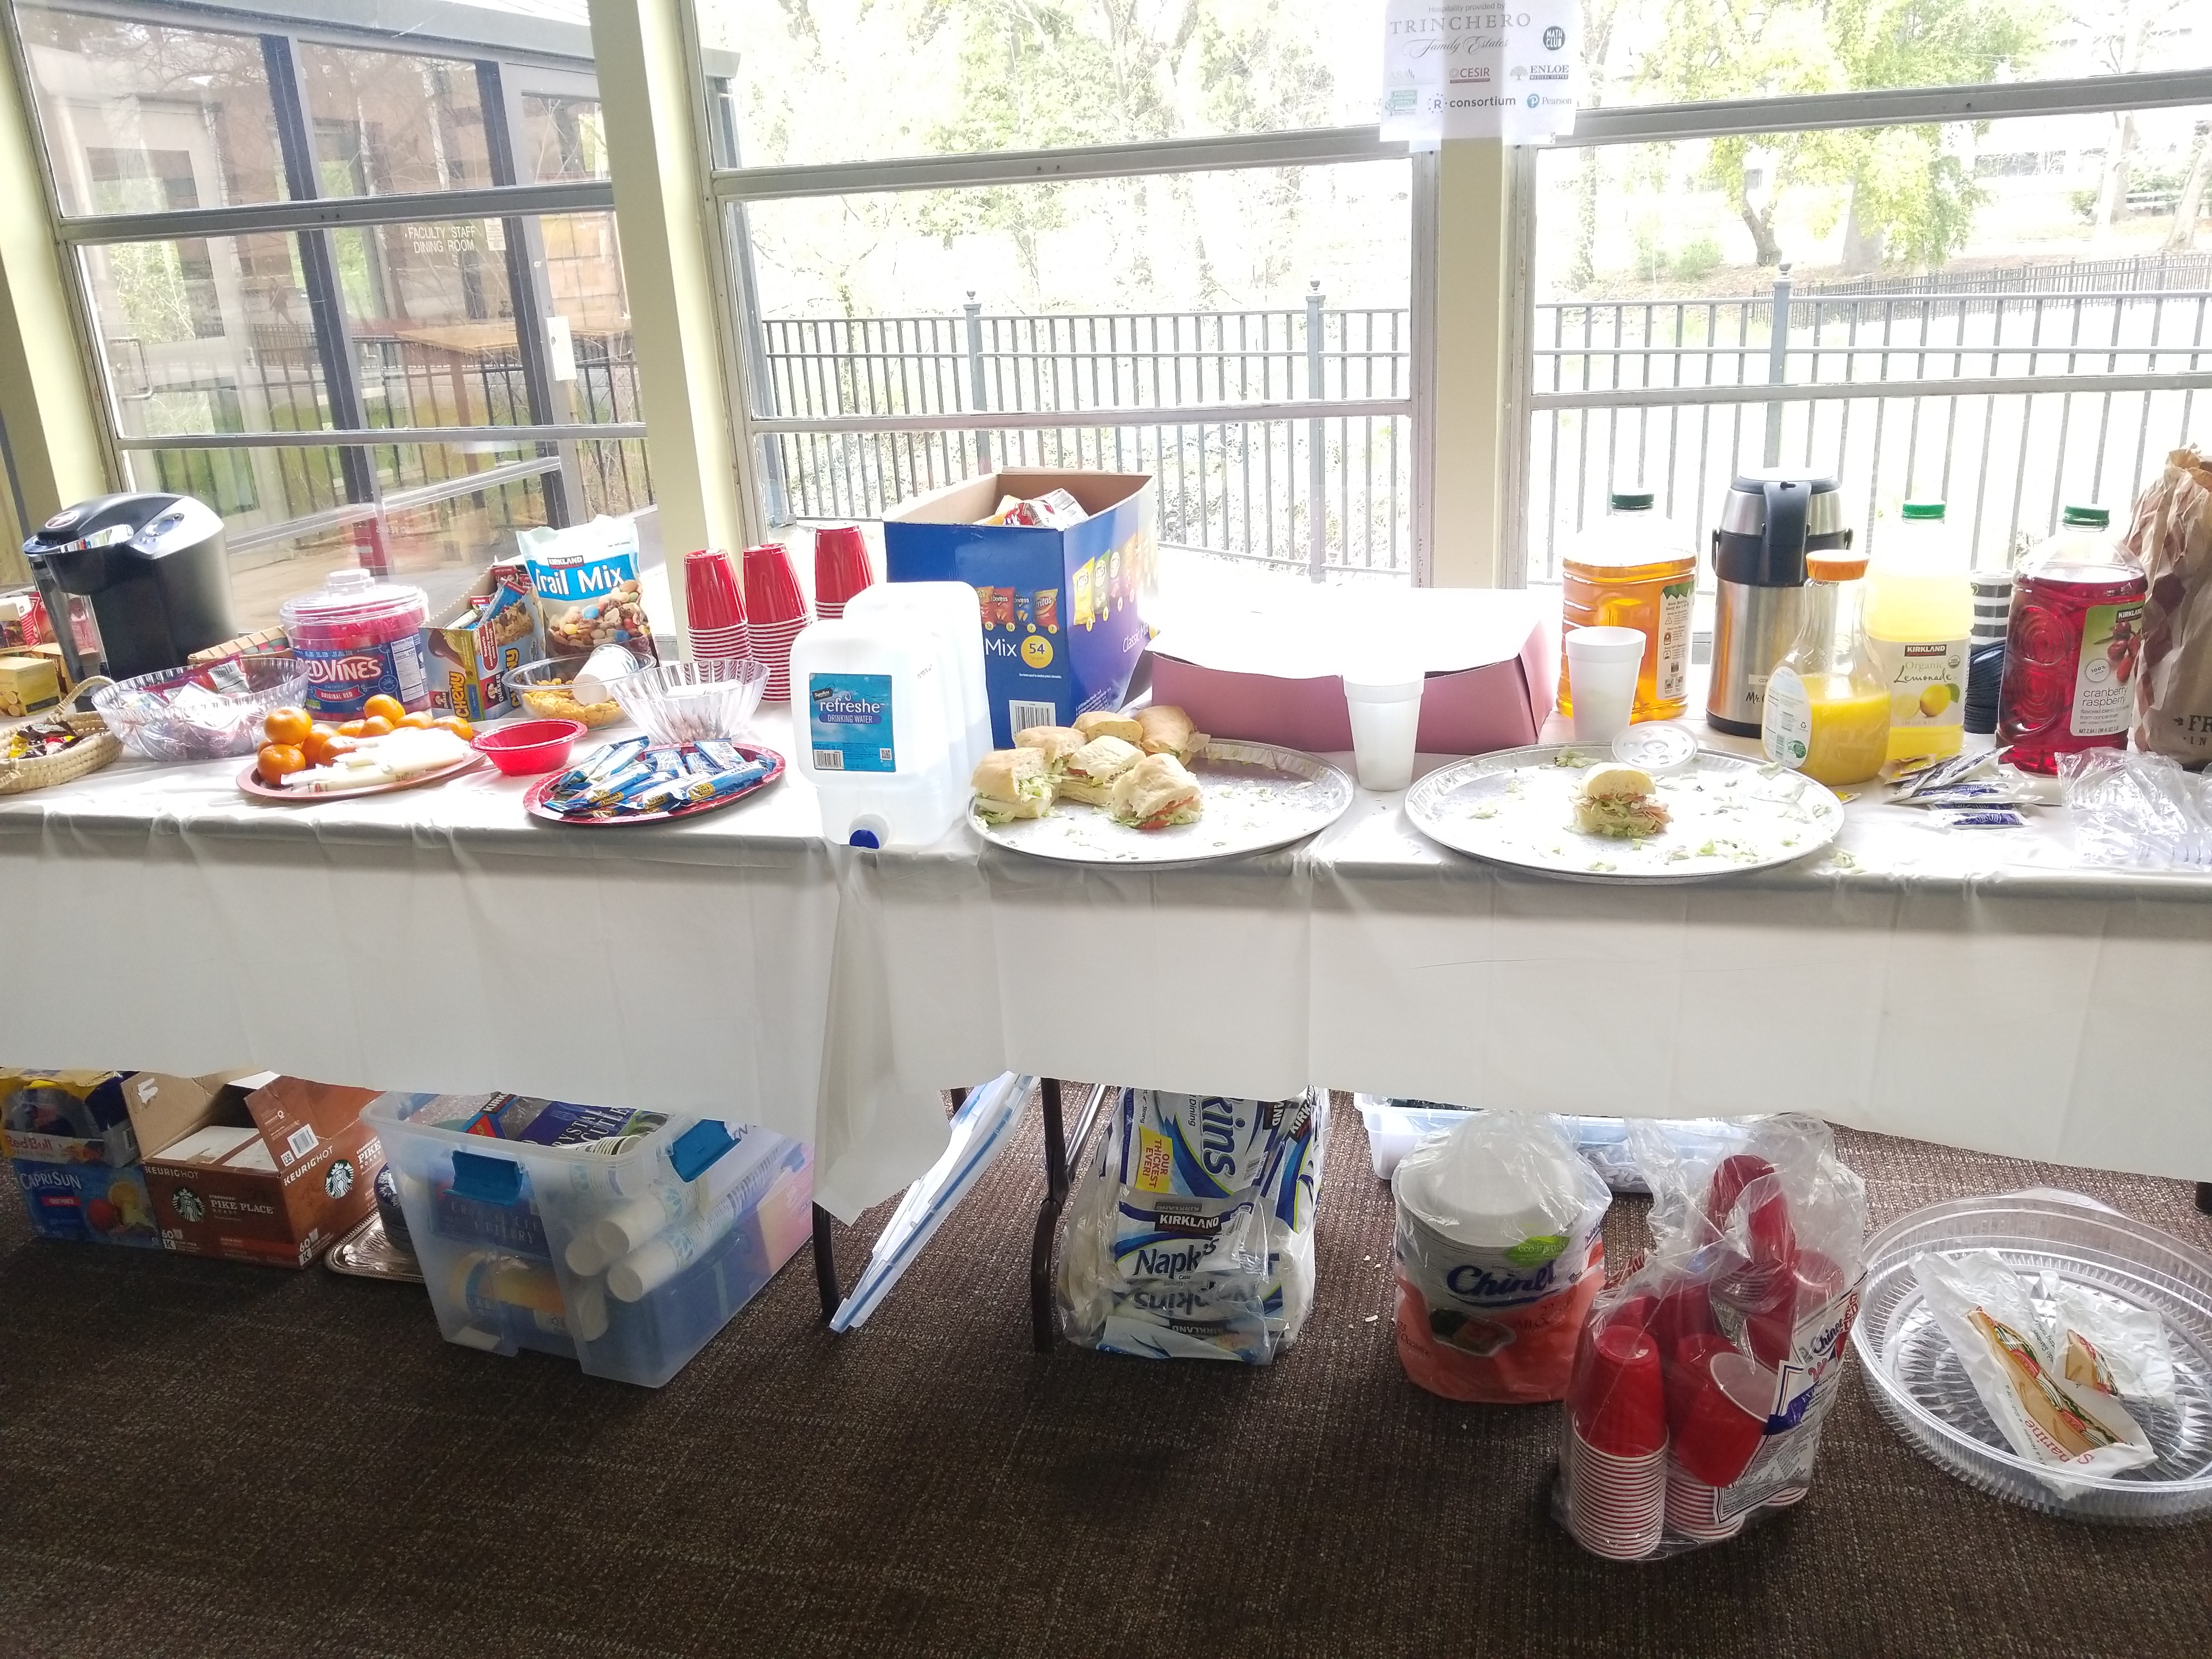
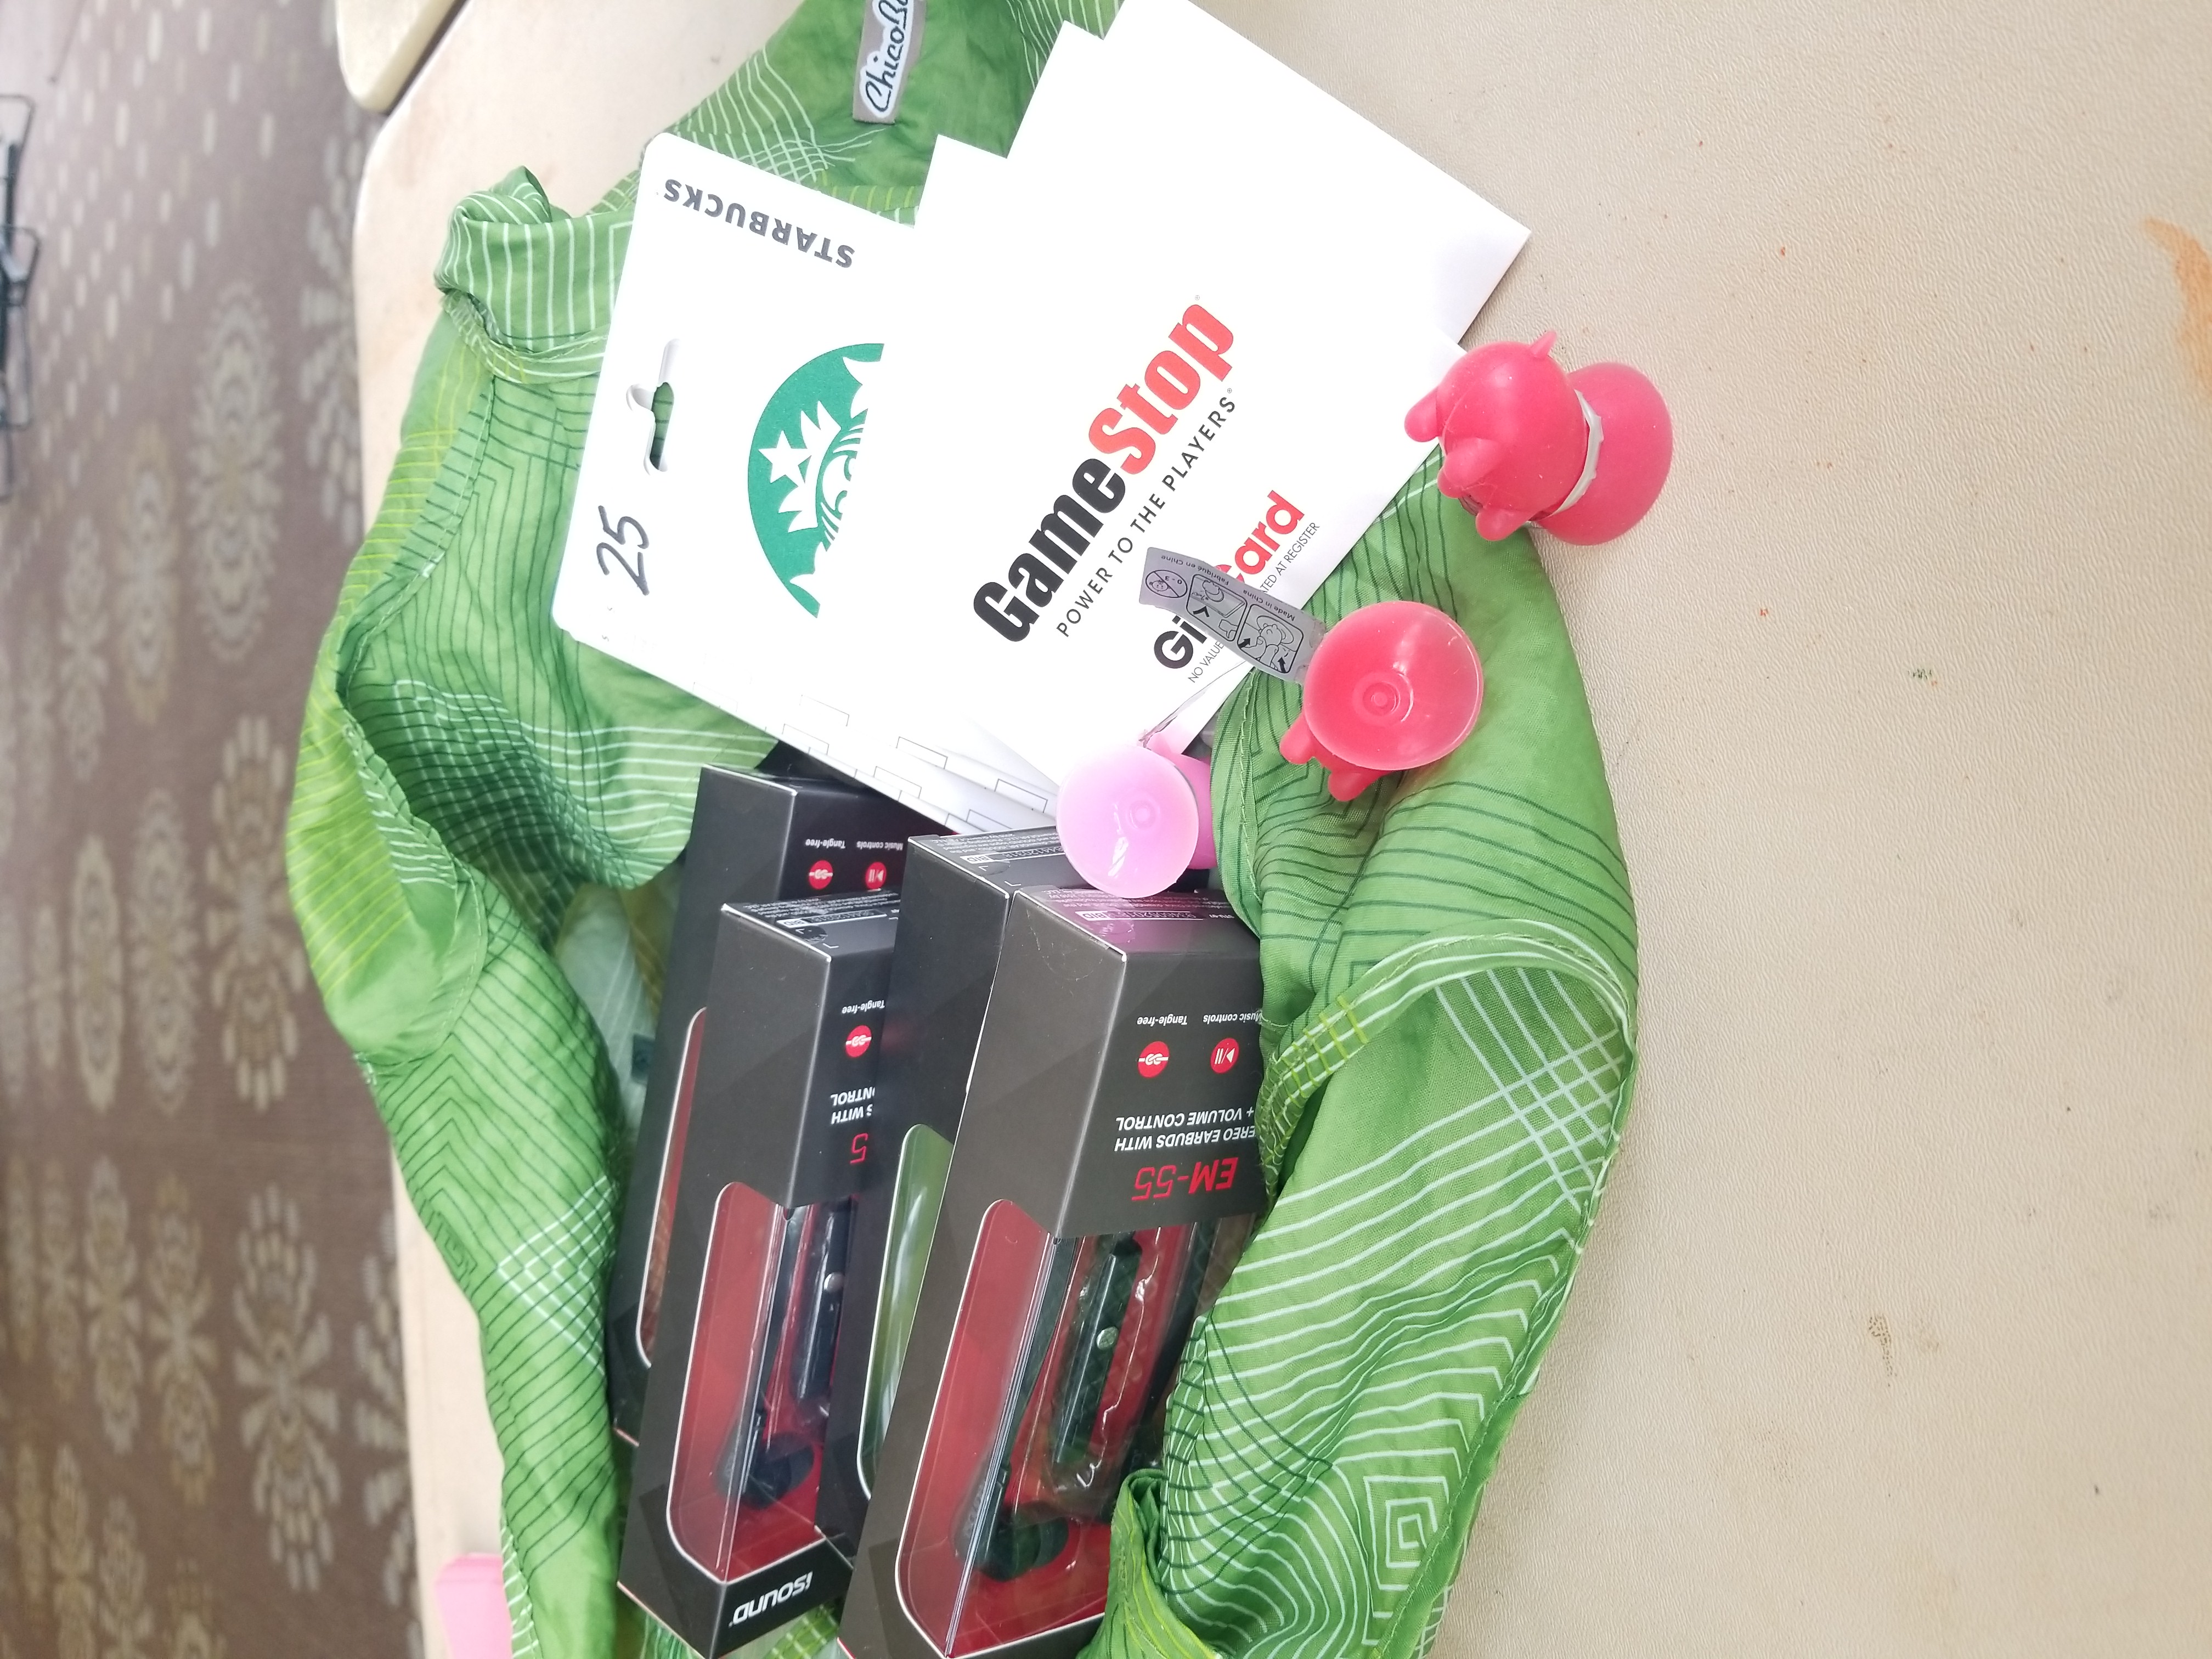
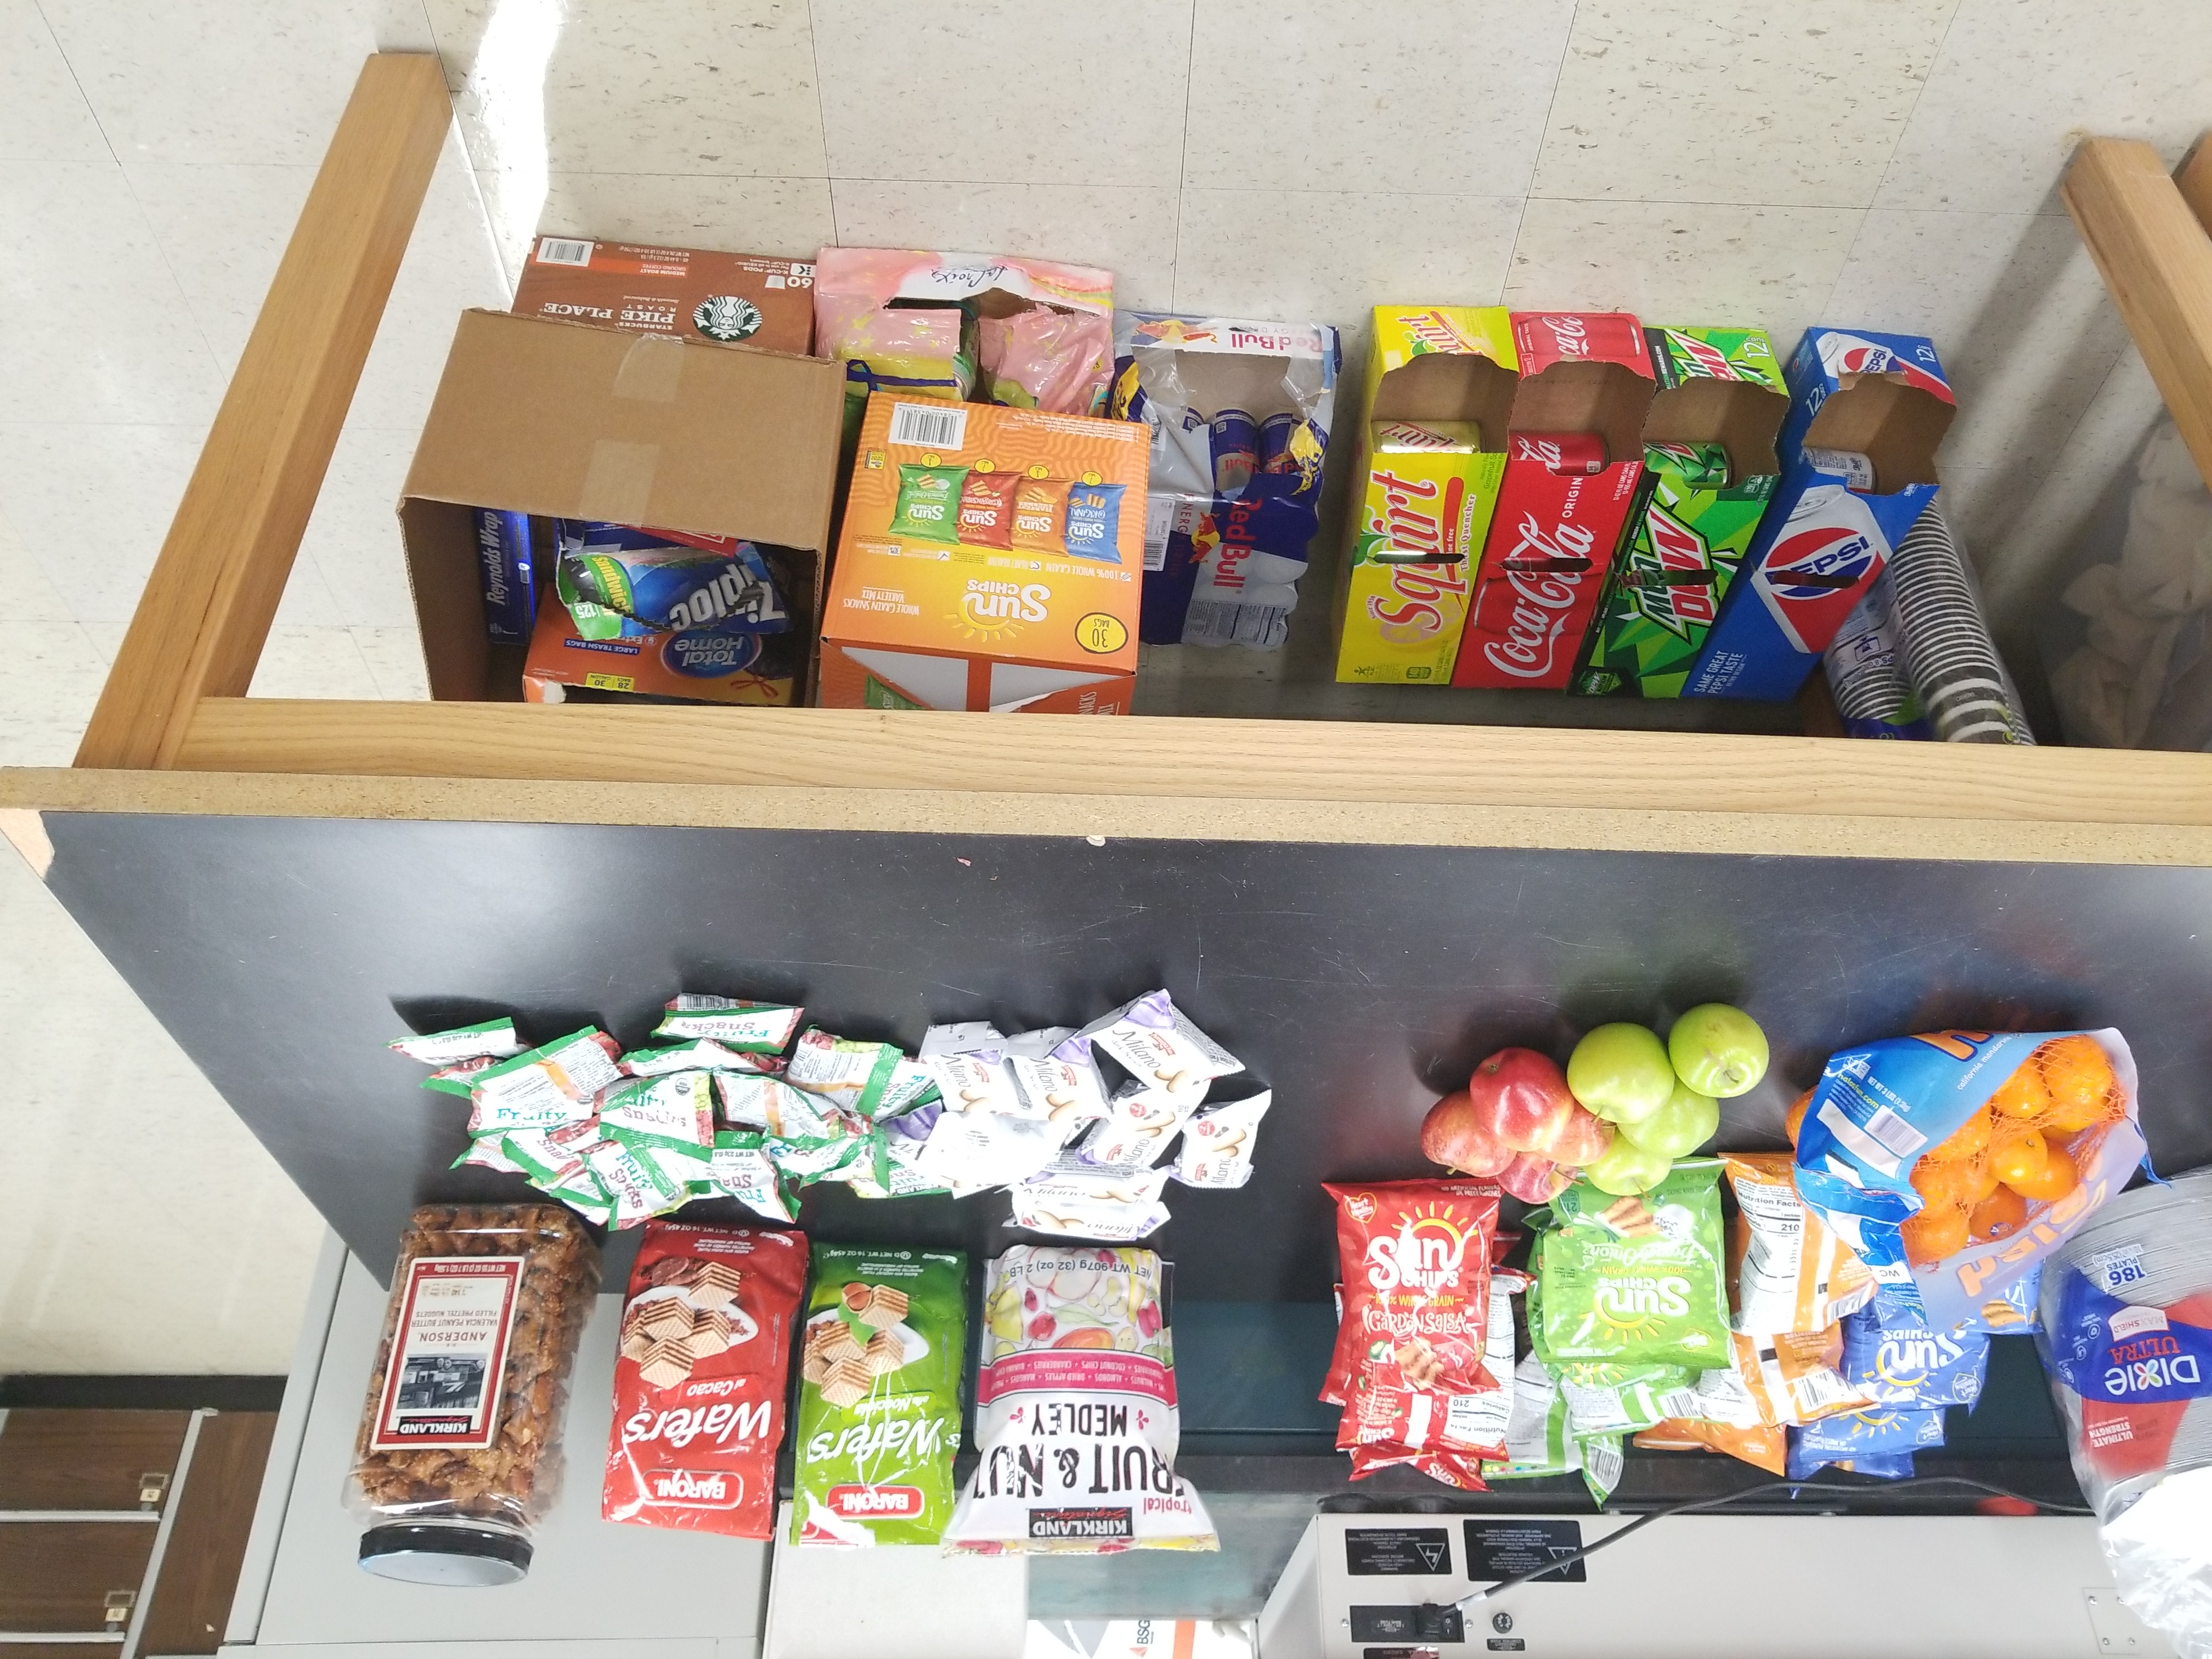
After two days of intense data wrangling, analysis, presentation design, interspersed with a lot of good free food and caffeine, each team presented their findings to a panel of judges consisting of both on and off campus professionals. Over $500 worth of prizes were awarded for the following categories:
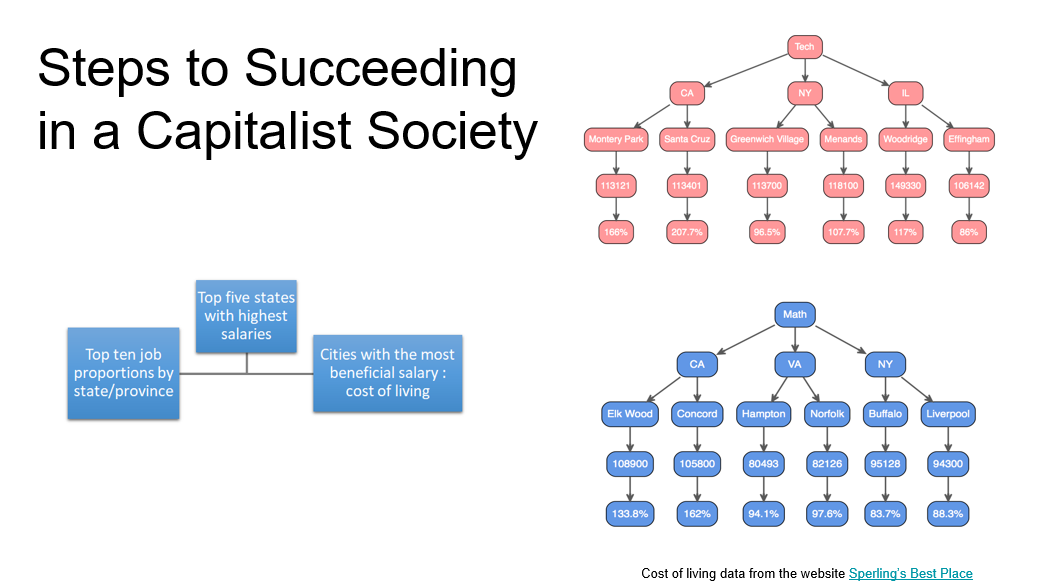
Best Use of Outside Data
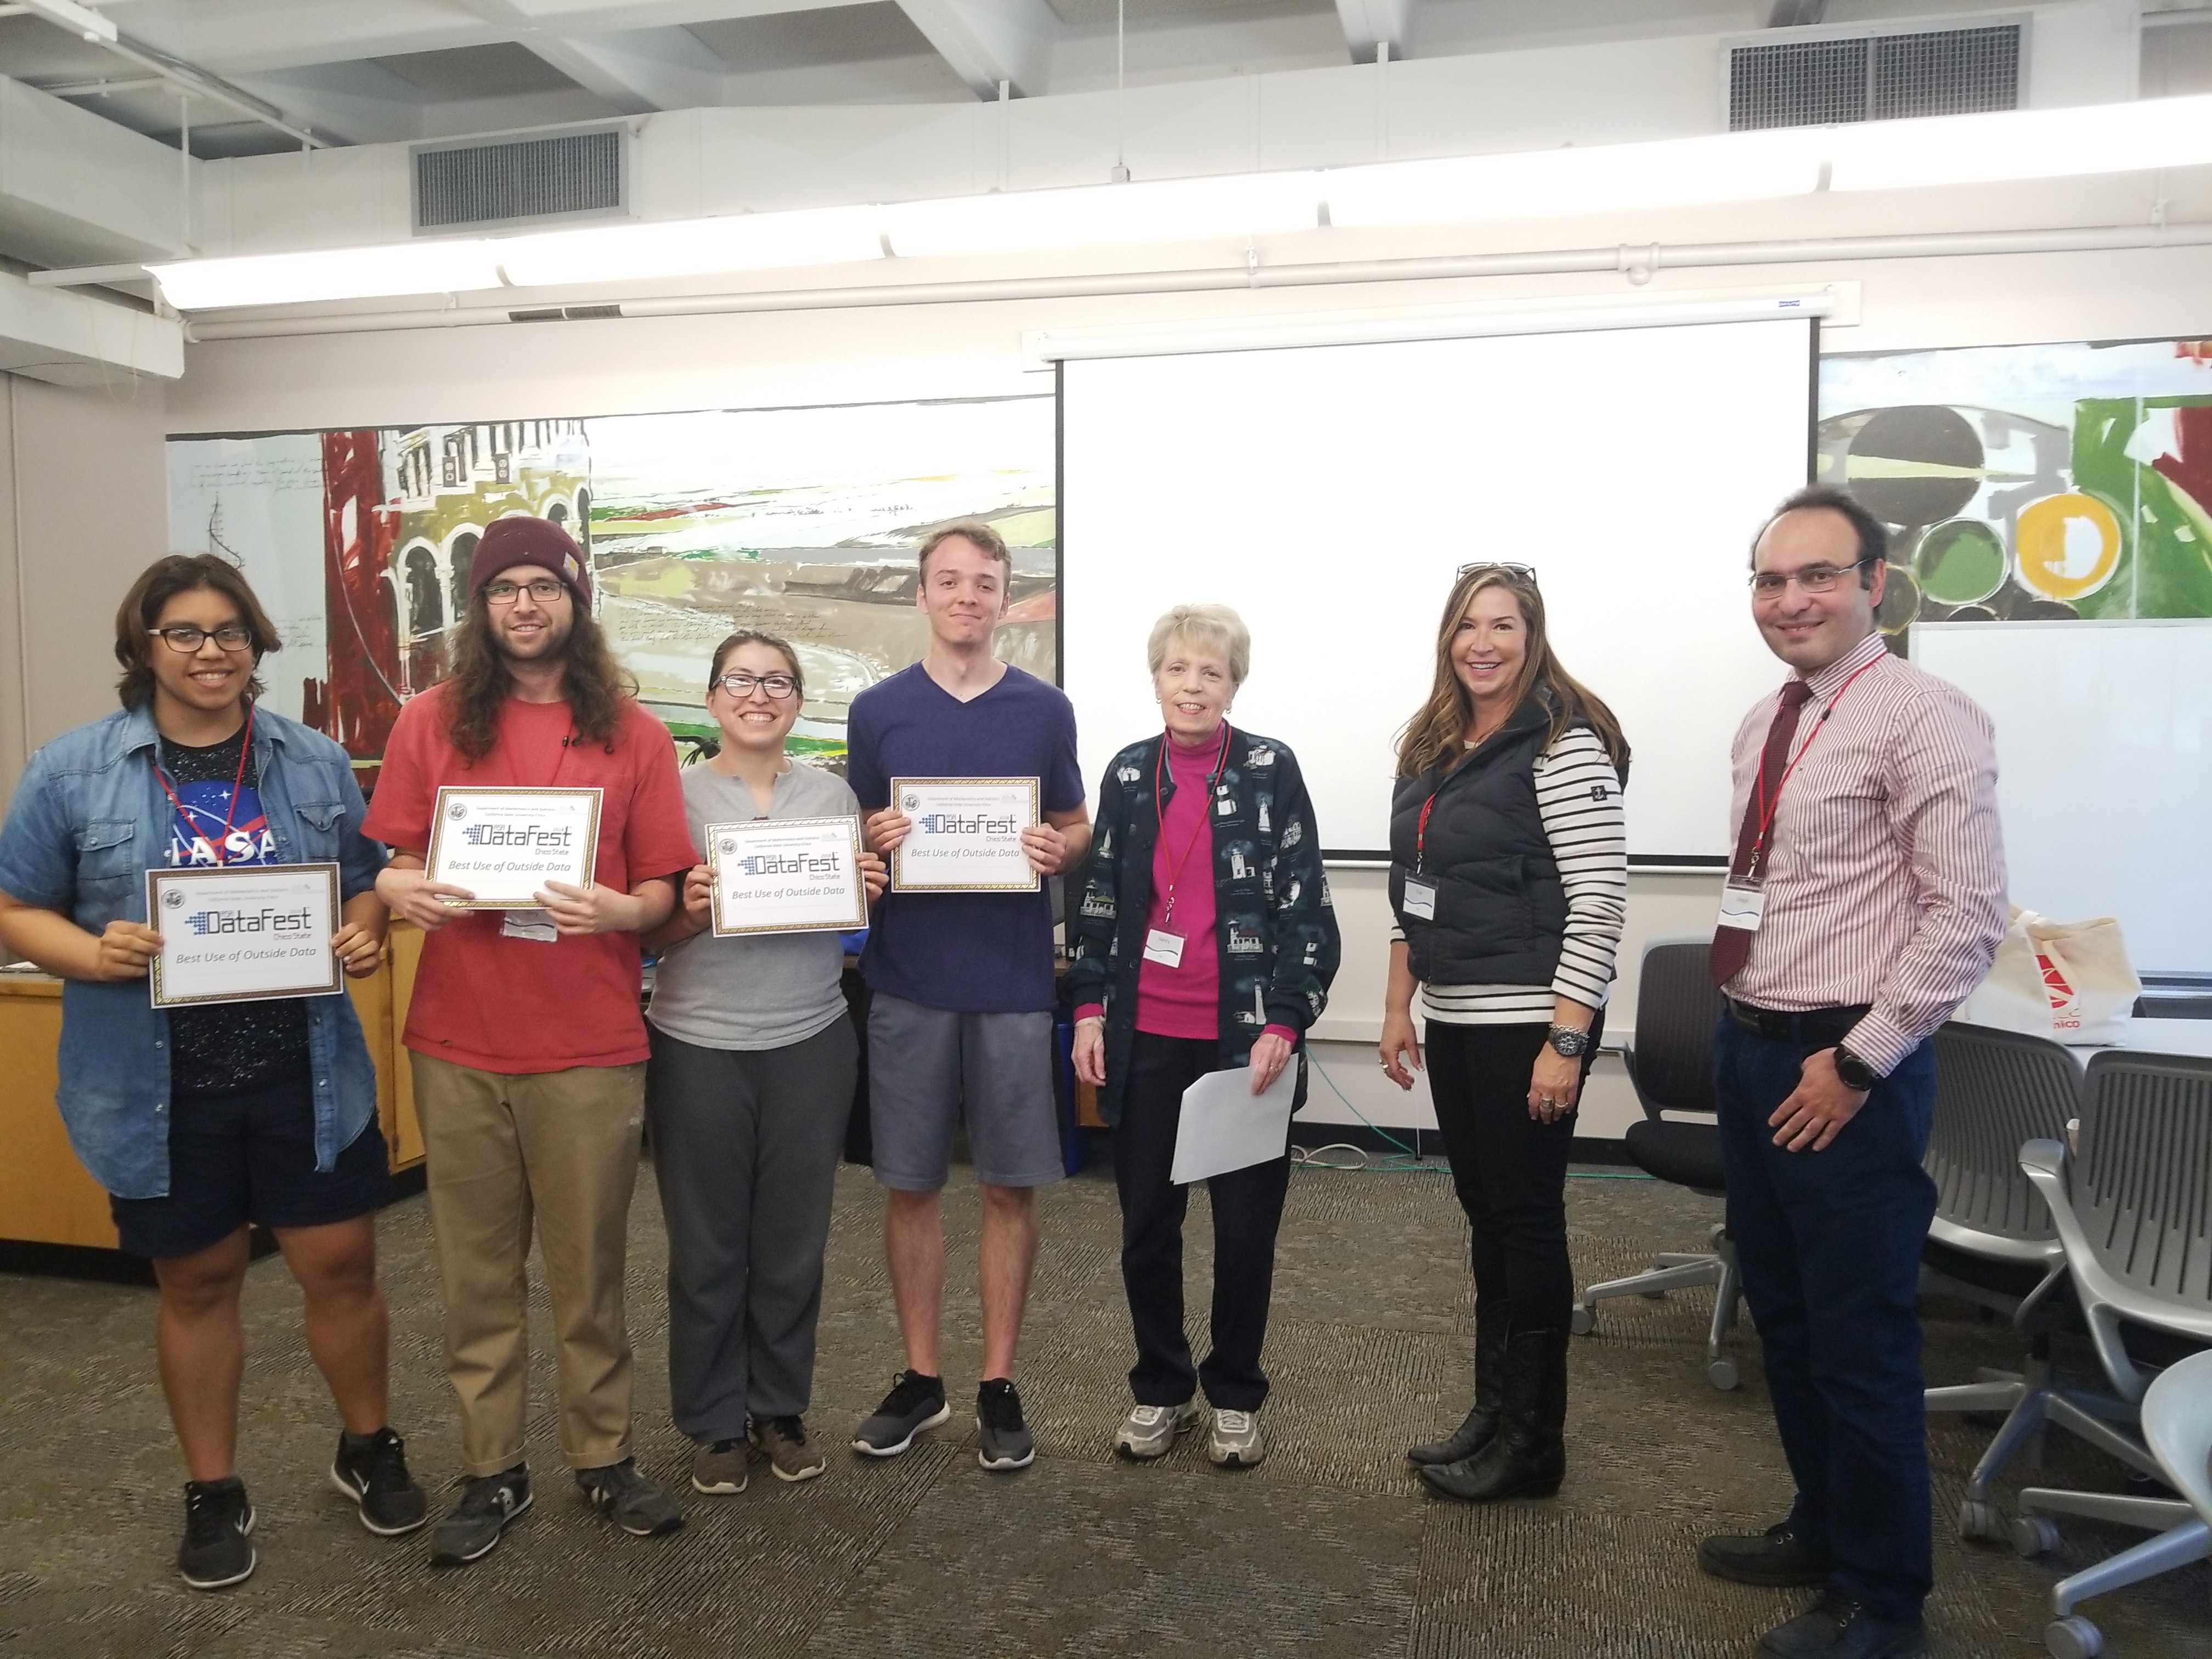 Eduardo Gomez, Jerry Tucay, Mariby Cruz, Mitch Borgert Eduardo Gomez, Jerry Tucay, Mariby Cruz, Mitch Borgert
|

|
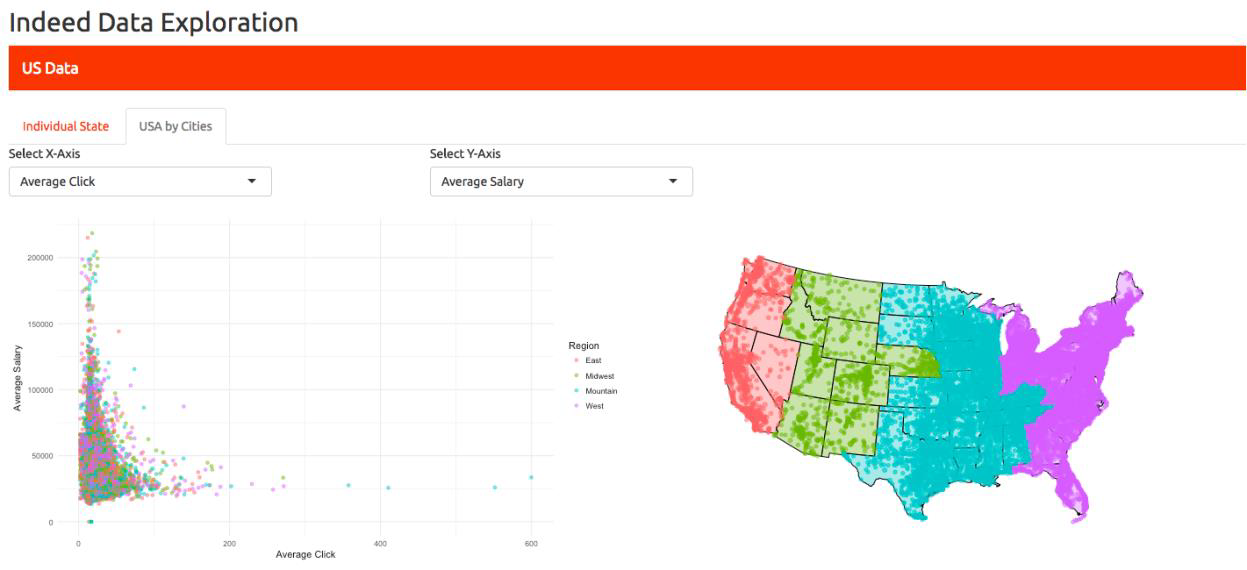
Best Visualization
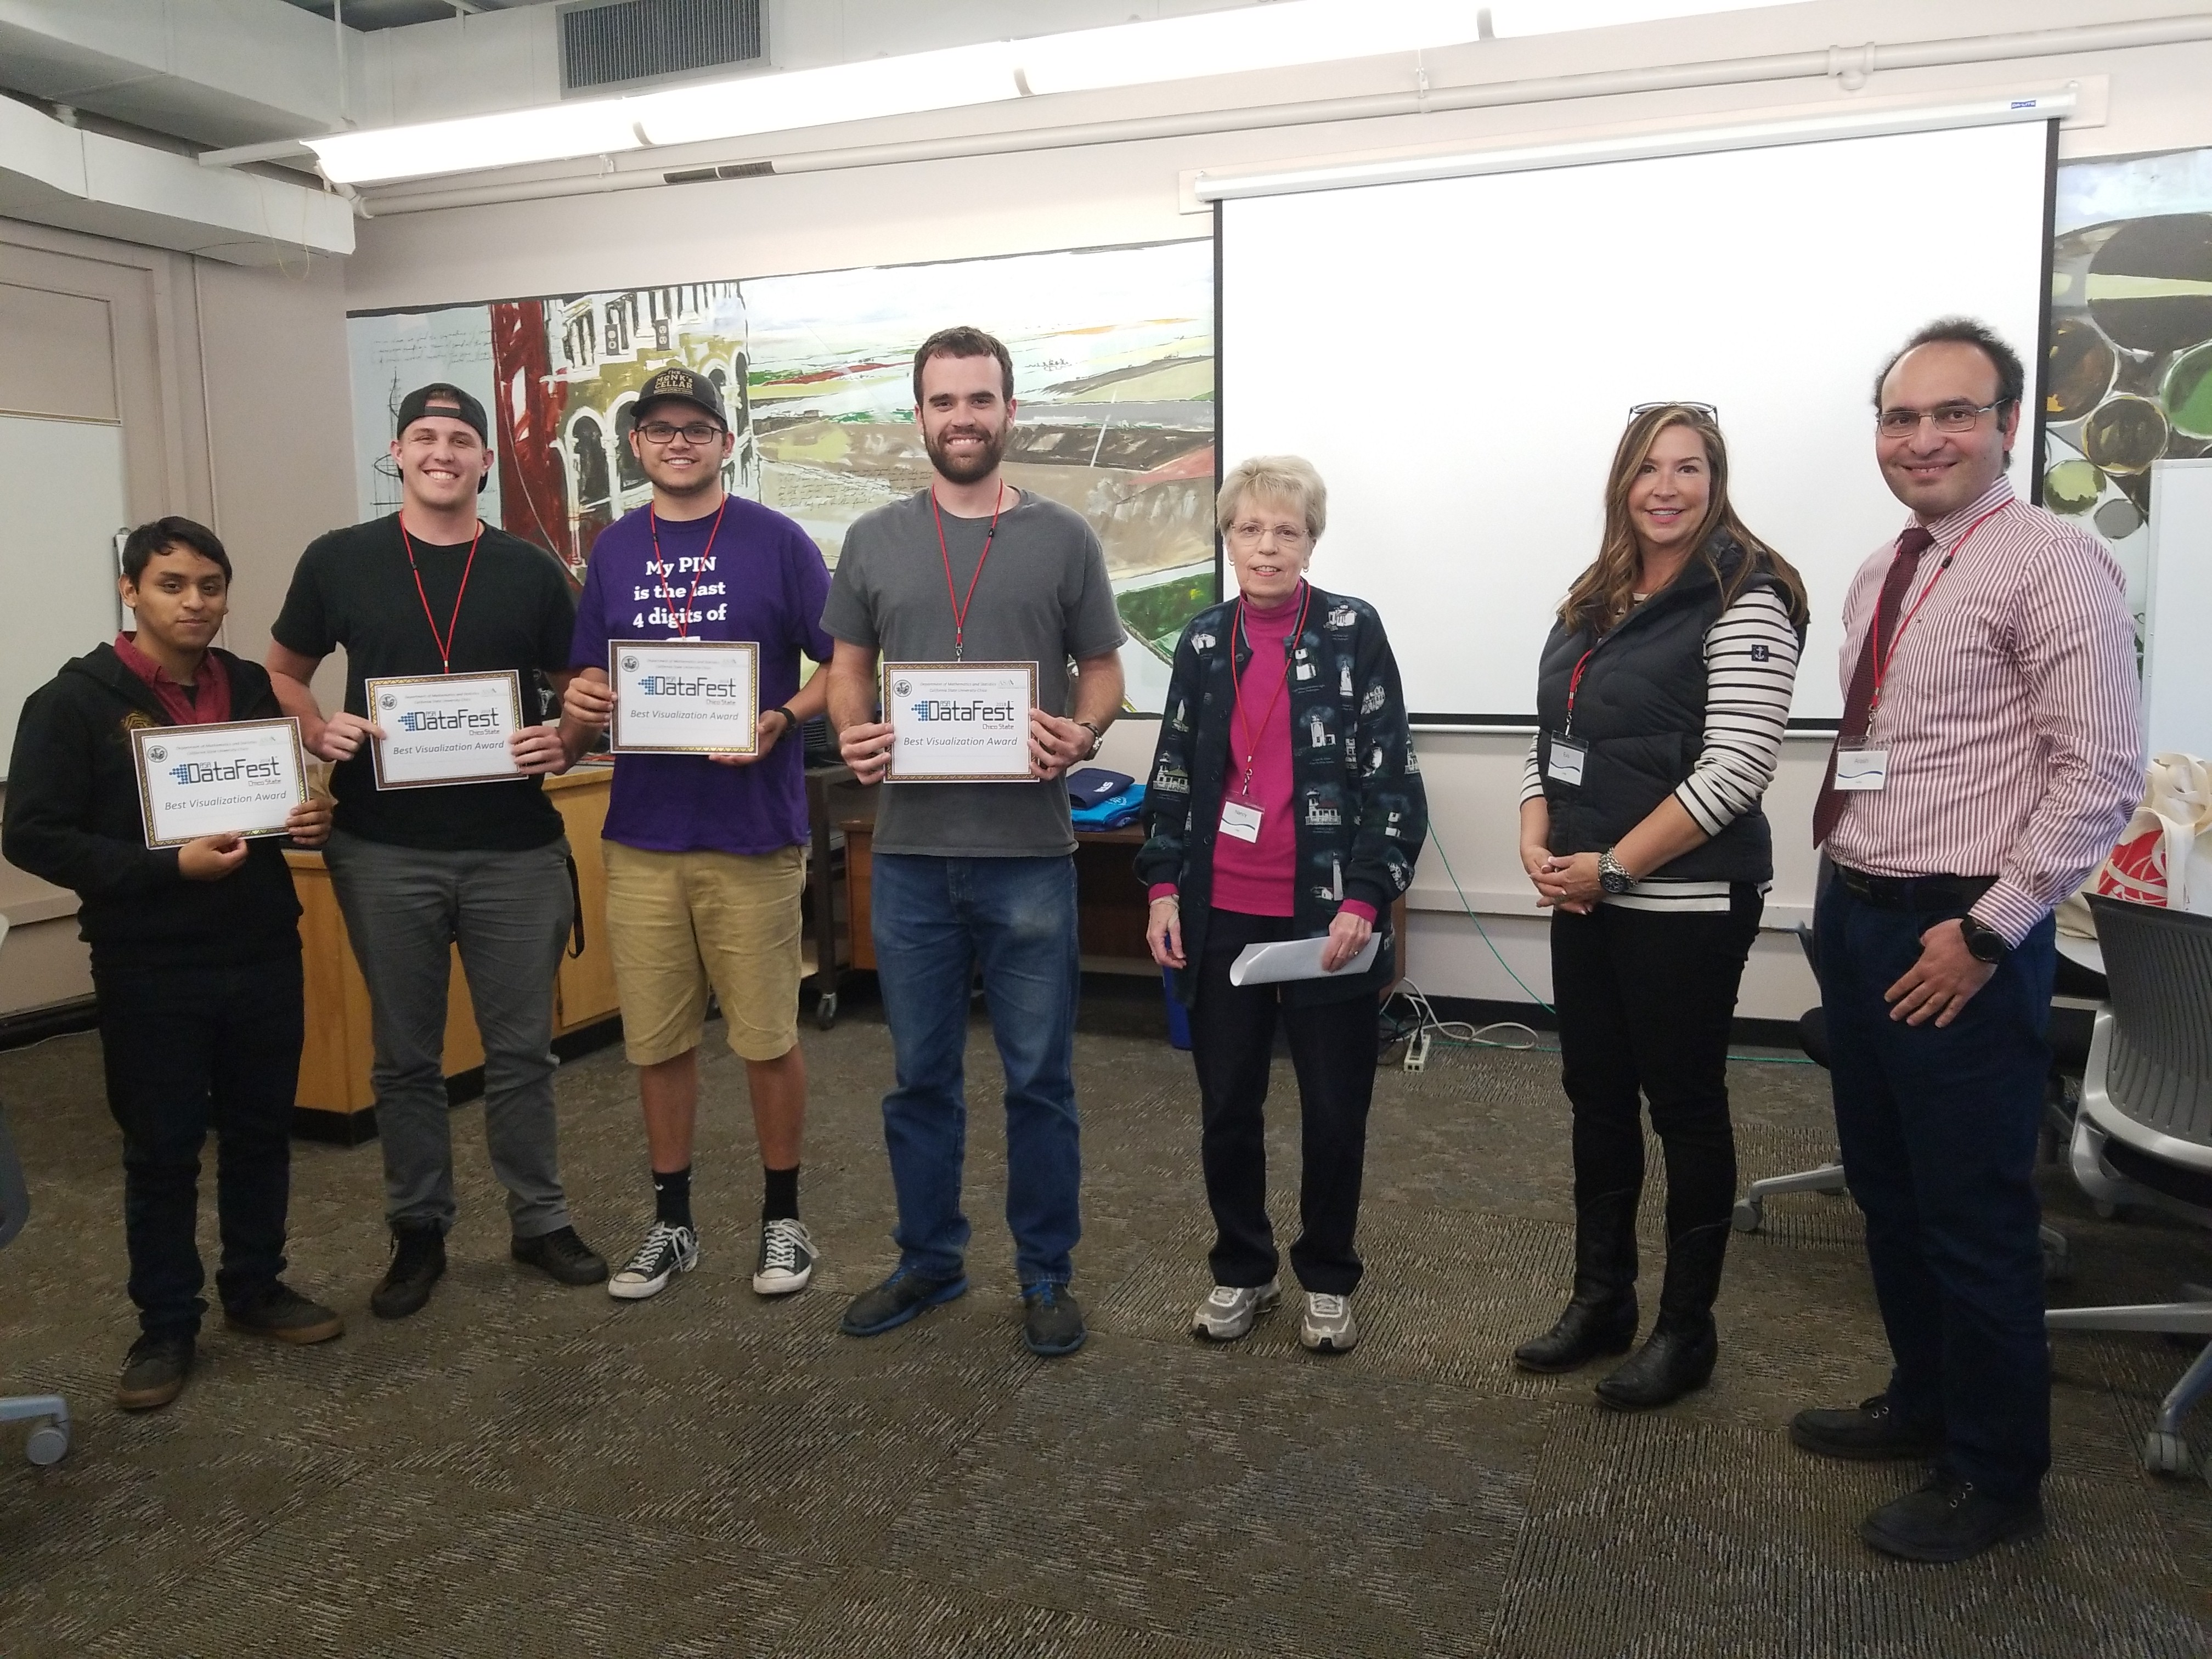 Pedro Valdiva, Mike Mulligan, Grant Esparza, James Dittig
|
|
Judges Choice and Best Discovery
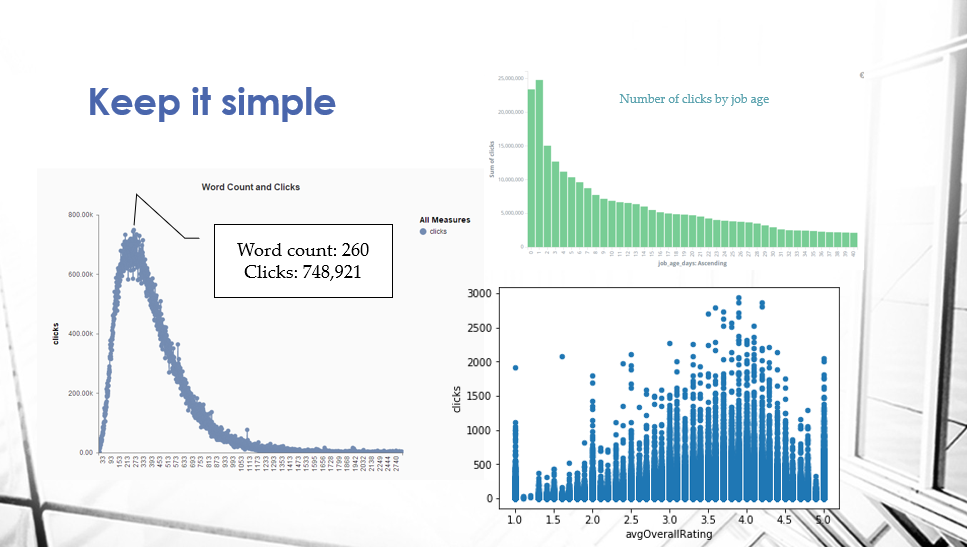
 Collin Deven, Eisley Adoremos, Ben Scanlan, Marisol Najera
|
|
Having fun!